- Stefan Rayer, Ph.D.
Asians were the fastest growing racial group in Florida and the United States from 2000 to 2010; the Asian alone population increased by 70.8% in Florida and by 43.3% in the United States (Table 1). Rapid growth continued for Asians from 2010 to 2012; only the Native Hawaiian and other Pacific Islander population in the United States, and the two or more races groups in Florida and the United States, grew faster in percentage terms since 2010. One should note that throughout this article ‘Asian’ refers to the Asian alone population; it excludes multiracial persons (e.g. Asian and White). Although comprising only 2.5% of the total population in Florida in 2012, and 5.0% of the total population in the United States, the fast growth of the Asian population in recent years warrants a closer look at this group. If trends continue, Asians will soon exceed the 500,000 mark in Florida.

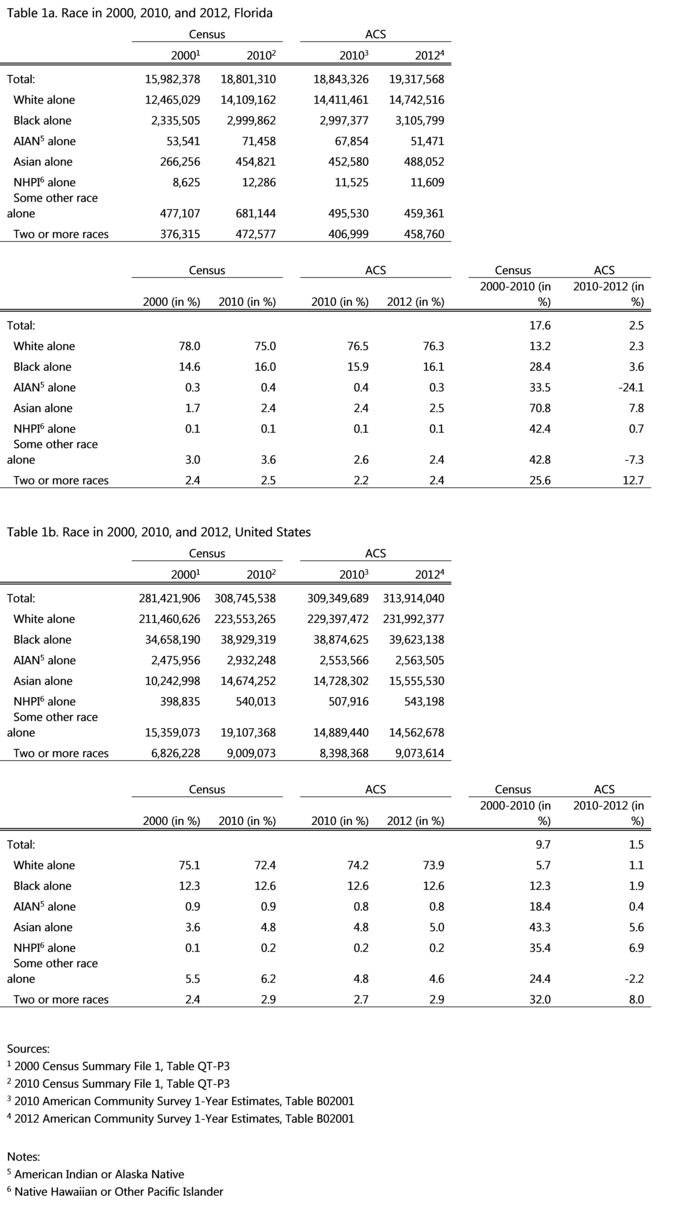
Table 2 shows the total population, the Asian population, and the percent of total population that is Asian for the 13 counties in Florida where the Asian population exceeded 10,000 persons in the 2010–2012 American Community Survey (ACS) 3-year estimates. These 3-year estimates represent data collected over a 36-month period from January 1, 2010 to December 31, 2012. The counties with the largest Asian populations in Florida were Broward (59,581), Orange (56,545), Hillsborough (43,526), Miami-Dade (40,092), Duval (36,358), Palm Beach (32,691), and Pinellas (27,704). In six other Florida counties the Asian population exceeded 10,000 in 2010–2012: Seminole (16,766), Alachua (13,393), Brevard (11,197), Polk (10,455), Lee (10,016), and Pasco (10,008). In terms of percentage of total population, Alachua County (5.4%) had the largest share Asian, followed by Orange (4.8) and Duval (4.2%).


The remainder of this article will look in more detail at the composition of the Asian population in the seven largest counties in Florida and their change over time as represented by six sets of 3-year ACS estimates starting in 2005–2007 and ending in 2010–2012. The seven counties (Duval, Orange, Hillsborough, Pinellas, Palm Beach, Broward, and Miami-Dade) will be presented in geographical order from north to south in the figures. Data for these seven counties will also be compared to the remaining sixty counties in the state, to Florida, and to the United States.
Figure 1 shows that the percent of the total population that is Asian increased in each of the seven largest counties in Florida, in the remainder of the state, in Florida, and in the nation overall from 2005–2007 to 2010–2012. By 2010–2012, Orange (4.8%) and Duval (4.2%) counties had the largest percentage of total population that is Asian among the seven counties while Miami-Dade County (1.6%) had the smallest. Shares were larger for the seven counties (3.0%) than for the remainder of the state (1.9%). The Asian population increased its share of total population from 2005–2007 to 2010–2012 most strongly in Duval County while increases in Pinellas and Miami-Dade counties were more modest.
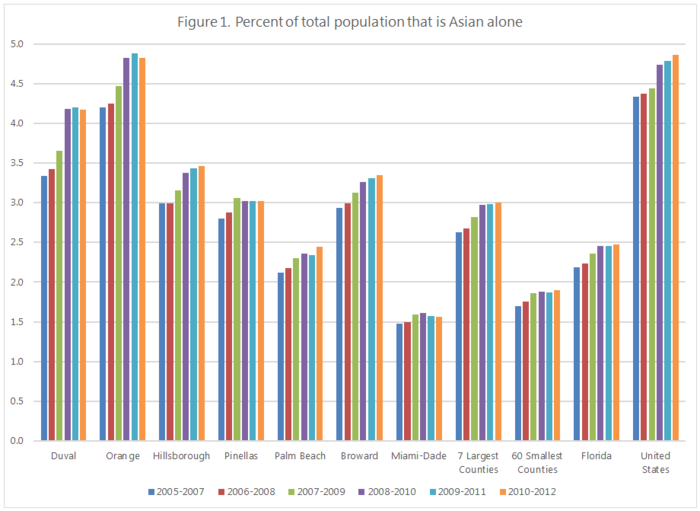

Figure 2 provides a more detailed look at the composition of the Asian population by selected groups in Florida. The figure presents data for eight Asian groups (Asian Indian, Chinese including Taiwanese, Filipino, Japanese, Korean, Pakistani, Thai, and Vietnamese); each of these groups had a population exceeding 10,000 people in the 2010–2012 ACS statewide. Also displayed are estimates for “Other Asians,” which is an aggregate category for Asian groups with smaller populations and includes Bangladeshi, Cambodian, Hmong, Indonesian, Laotian, Malaysian, Sri Lankan, and other Asian (not specified) groups. Figure 2 shows that Asian Indians represent the largest Asian group in Florida, accounting for over a quarter of the total Asian population in 2010–2012. The next largest groups were Filipinos, Chinese, and Vietnamese, each representing about 15–20% of the total Asian population. From 2005–2007 to 2010–2012 the share of the total Asian population that was Asian Indian, Filipino, Japanese, and Korean declined slightly, while Chinese, Pakistanis, Vietnamese, and other Asians increased their share; the proportion Thai remained relatively stable.

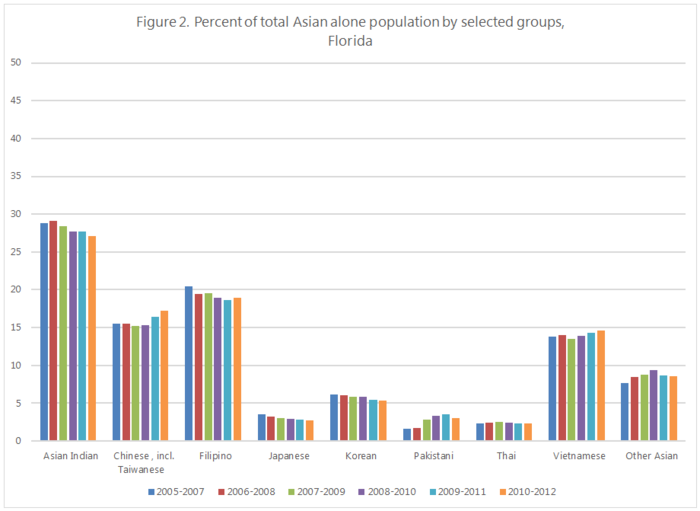
Figure 3 presents comparable data for the United States. Nationwide, Chinese form the largest Asian group, followed by Asian Indians, Filipinos, Vietnamese, and Koreans. Similar to trends in Florida, Filipinos, Japanese, and Koreans declined slightly as a percent of the total Asian population from 2005–2007 to 2010–2012, while Pakistanis and other Asians increased their share. In contrast to Florida, Asian Indians slightly increased their share in the United States, while the Vietnamese share decreased slightly. The share of the total Asian population that is Chinese and Thai remained fairly stable over that period in the United States.

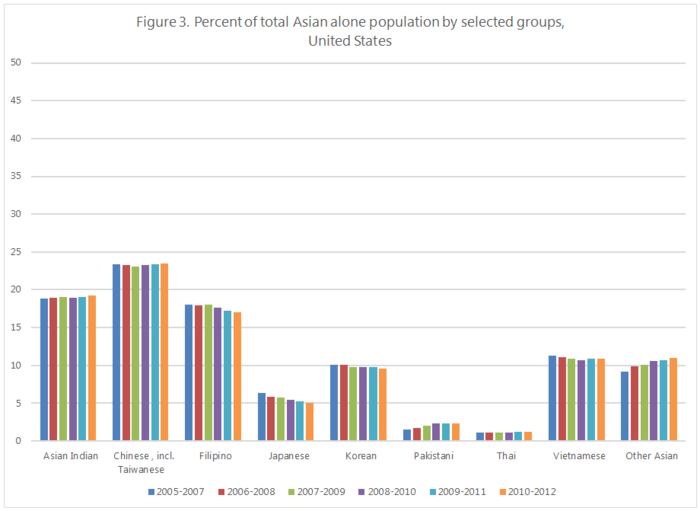
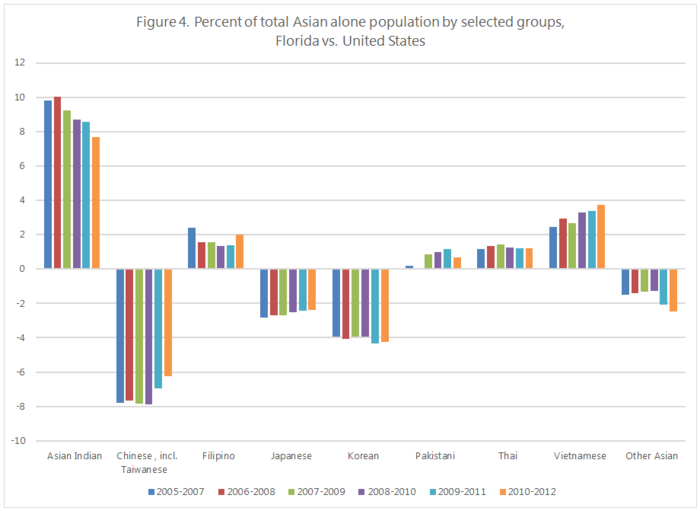
Figure 4 examines the differences between Florida and the United States in the shares of the total Asian population of the various groups. Compared to the nation overall, Asian Indians formed a much larger share of the total Asian population in Florida, and Chinese a much smaller; for both groups the differences became somewhat smaller from 2005–2007 to 2010–2012. The shares for the other groups were not that different between Florida and the United States; compared to the nation, Florida had slightly larger shares of Vietnamese, Filipinos, Thais, and Pakistanis, and smaller shares of Koreans, Japanese, and other Asians.

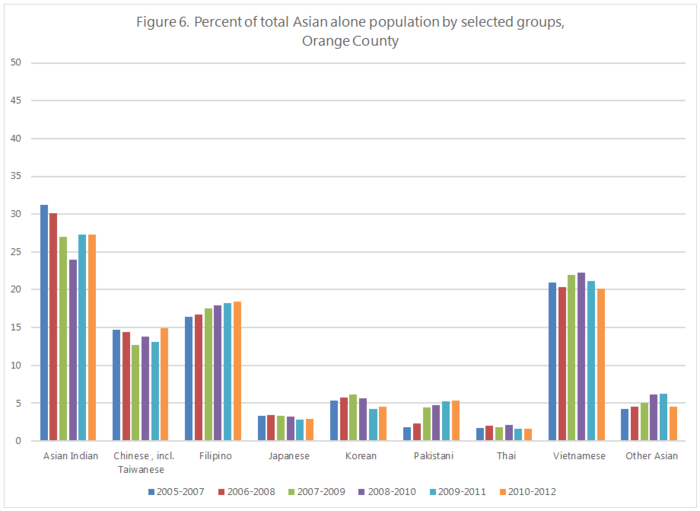
Figures 5 through 11 show the composition of the Asian population by selected groups for the seven largest counties in Florida. In four of the seven largest counties (Orange, Hillsborough, Palm Beach, and Broward), Asian Indians formed the largest Asian group; they were also the second largest Asian group in Duval, Pinellas, and Miami-Dade counties. Filipinos comprised the largest Asian group in Duval County, Vietnamese in Pinellas County, and Chinese in Miami-Dade County. Among the seven counties, Miami-Dade was the only county that saw a change in which Asian group was the largest between 2005–2007 and 2010–2012; Asians Indians were the largest group in the county until 2006–2008, after which Chinese became the largest group.

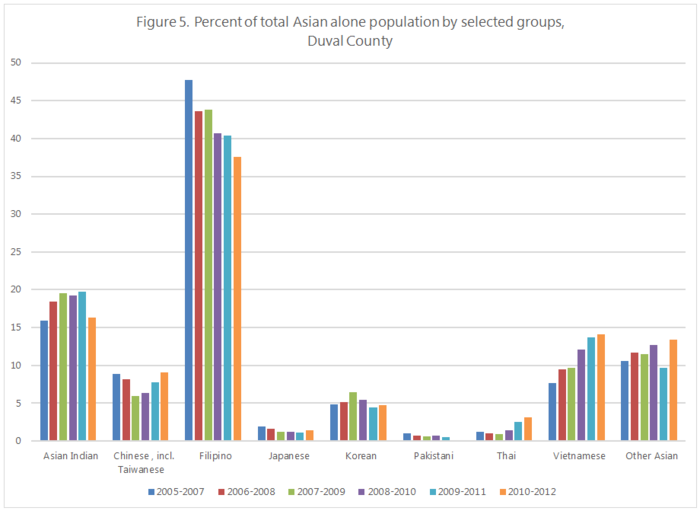
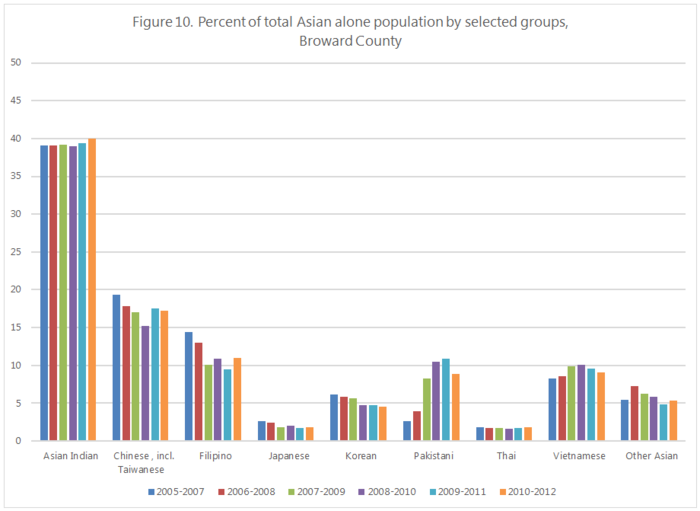
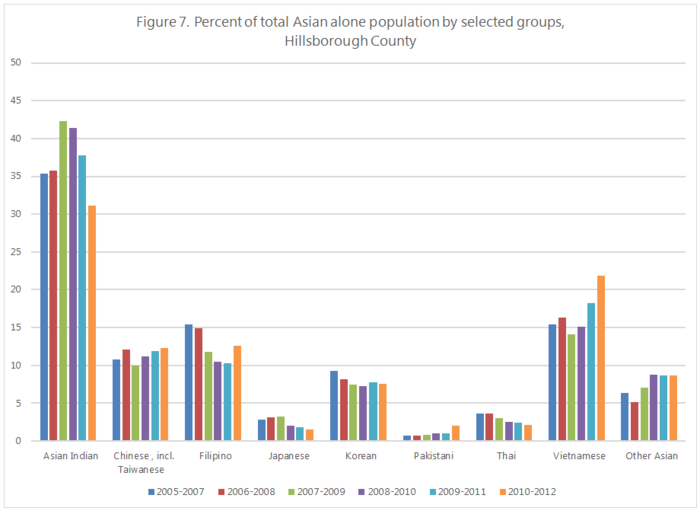
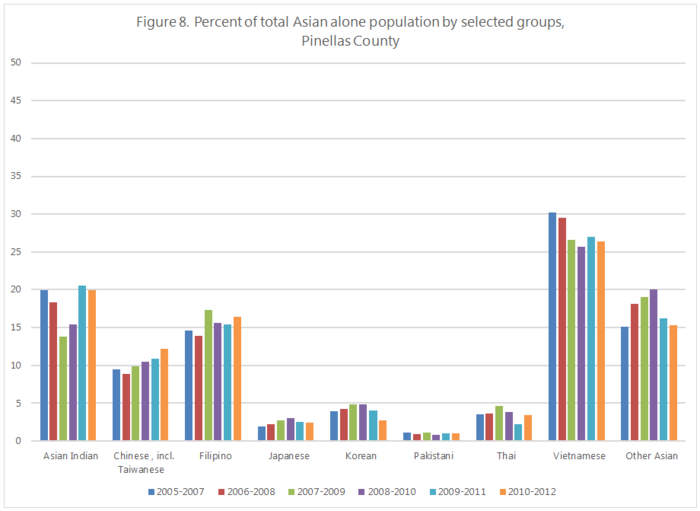
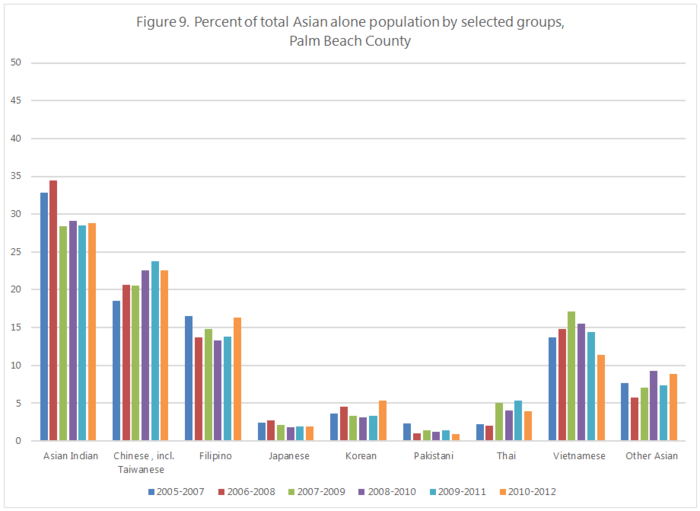
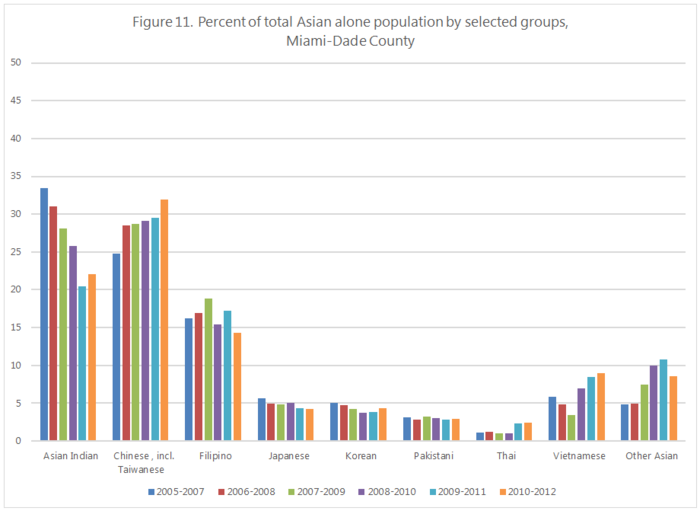


Several groups increased or decreased their share of the total Asian population quite consistently across the seven large counties from 2005–2007 to 2010–2012. The share of the Asian population that was Chinese went up in all counties but Broward; the Japanese share went down in all counties but Pinellas; the Korean share went down in all counties but Palm Beach; and the share of the other Asian population went up in most areas. For some groups, the shares bounced up and down over the period (e.g. Chinese in Orange County, Filipinos in Miami-Dade County), apparently showing no clear trend. While some of these year-to-year variations may represent actual population changes, one should note that at the county level the populations for many of these groups are not that large, and that the ACS data are based on rather small samples. Especially for smaller groups, the margin of error associated with the ACS estimates can be quite large, and year-to-year comparisons should be made with caution. That said, Figures 5 through 11 indicate general trends for many of these groups – upward, downward, or relatively constant – over the seven year period covered by the 2005–2007 to 2010–2012 ACS data, which provide insights into the changing composition of the Asian population in Florida.
To investigate how the composition of the Asian population compares between the seven largest counties and the rest of Florida, Figure 12 provides aggregate data for the seven largest counties, Figure 13 gives aggregate data for the remaining 60 counties, and Figure 14 displays the differences in the shares between the seven largest counties and the rest of Florida. Asian Indians formed the largest Asian group in both aggregate areas, followed by Filipinos, Chinese, and Vietnamese. Compared to the sometimes quite sizeable differences between Florida and the United States in the shares of the various Asian groups, which were most pronounced for Asian Indians and Chinese (Figure 4), the differences between the seven largest counties in Florida and the remainder of the state are more modest (Figure 14). Asian Indians comprise a larger share in the large counties, but the differences have moderated over time; Pakistanis and Vietnamese also have slightly larger shares in the seven large counties. Filipinos, Japanese, and Koreans have smaller shares in the remainder of the state while there are no discernible differences for Chinese, Thais, and other Asians.


To summarize, the United States, Florida, and many counties in the state have experienced a rapid increase in the Asian population since 2000. Though accounting for only 2.5% of total population in Florida in 2012, the Asian population has grown measurably in many areas of the state. The Asian alone population was estimated at just under half a million in the 2012 ACS, and another 130,000 persons were estimated to be Asian and one or more other race(s). What accounts for the rapid growth in the Asian population? Populations increase through births and in-migration, and decrease through deaths and out-migration. A future article in this series will look in more detail at the components of population change for Florida’s Asian population.
