
Publication Date:
- Stanley K. Smith, Ph.D.
- Scott Cody, M.B.A
The idea is that we estimate what the U.S. Census Bureau would have counted if they conducted a census every year.
The U.S. Census Bureau conducts a complete count of the population of states, counties, and cities every ten years. For each year between these counts, demographers at the Bureau of Economic and Business Research (BEBR) produce estimates of the permanent resident population for Florida and each of its counties and incorporated cities. These estimates are used for revenue-sharing purposes by the Florida Department of Revenue. In addition, they are also used by planners, businesses and researchers for many purposes, such as tracking demographic trends, evaluating potential locations for new housing developments and shopping centers, and determining the need for new schools, roads and fire stations. The idea is that we estimate what the U.S. Census Bureau would have counted if they conducted a census every year.
So how do we estimate the population without actually counting? There are many ways to do this but most use some collectable data as a proxy either for housing units or for sub-groups of population, and make inferences that translate those data into population estimates.
The Administrative Records Approach uses data from IRS tax returns to estimate the domestic migration of the under-age-65 population, Medicare data to estimate the over-65 population, immigration data to estimate net international migration, and vital statistics data to estimate births and deaths. This approach can work well for county population estimates but the data are usually not available for cities.
Another approach, the one we use, is the Housing Unit Method. In this method, we use electric customer counts, building permit data and home exemption data to estimate the number of permanent households. We multiply this estimate by an estimate of average household size to produce an estimate of the population living in households. The final estimate is made by adding in the population living in group quarters facilities such as prisons, college dormitories, nursing homes and military barracks.
What steps do we follow? First we must gather base data for as close to April 1st (the census day) as possible. These include data from the most recent census such as housing units, households, average household size and persons living in group quarters. Then we collect indirect data for the same time frame to match with the census data. These data include active residential electric customers, building permits, various data for group quarters facilities, annexation reports and homestead exemption data.
We use the housing unit method to make household estimates using electric customers, building permits and—for counties—homestead exemptions. We make several estimates based on these data sources. Approximately two-thirds of our final estimates are based on some version of the electric customer method and the rest are based on building permits, homestead exemptions, or averages of different methods. In some instances we make adjustments to our regular methods to account for special circumstances.

The electric customer and homestead exemption methods operate essentially the same way. Changes in electric customers or homestead exemptions indicate changes in permanent households. We calculate the ratio of the number of households counted in the most recent census to the number of electric customers or homestead exemptions on the same date. We then multiply that ratio to the current count of electric customers or homestead exemptions. For example, if the 2010 census counted 90 permanent households and there were 100 active residential electric customers on that date, then the assumption would be that each electric customer represents 0.9 permanent households. If there are now 150 electric customers then we would estimate that there are now 135 permanent households (.9 X 150). These ratios are sometimes modified to reflect historical trends or changes in demographic characteristics.
The process is a bit different for building permit data. Under this method, we add the building permits added since the most recent census (adjusted to account for the time needed to turn a building permit into a completed unit) to the number of housing units counted in that census. Then, we apply an occupancy rate to produce an estimate of the number of housing units occupied by permanent residents. Occupancy rates are typically based on the rates calculated in the most recent census, but measures of changing rates are used when available.
For estimates of average household size, we start with the value calculated in the most recent census. Fortunately, those numbers don’t change very rapidly for most localities. Like with the occupancy rate, we use historical trends and changes in demographic characteristics to estimate current values for average household size. Estimates of average household size are then multiplied by the household estimates to provide estimates of the population living in households.
The final population estimate requires an estimate of the population living in group quarters (GQ) facilities. In places where the GQ population is large or accounts for a large proportion of the total population, we contact the administrators of each facility to collect information on the current number of residents. In places where the GQ population is small or accounts for a small proportion of the total population, we assume that it accounts for the same proportion of the total population now as it did in the most recent census. For example, if the GQ population accounted for 1 percent of the total population in the 2010 census, we assume that it still accounts for 1 percent of the total population.
The estimate of the total population is obtained by adding the estimate of the GQ population to the estimate of the population living in households.
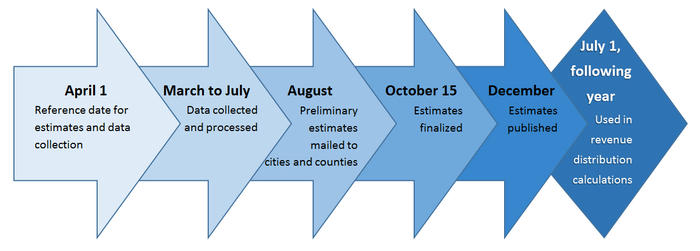
For each year, the indirect data are gathered between April and June and processed in June and July. This process produces various estimates based on the data under the different assumptions. We review these estimates city by city and make a judgment regarding what we believe is the most reasonable estimate. This is also done for the unincorporated area of each county. City and unincorporated estimates are summed up to produce county estimates and county estimates are summed to produce the state estimate.
In early August of each year, a form is mailed to each city and county, informing them of their preliminary population estimate. They are given about a month to respond back indicating whether they agree or disagree with our estimate. If they disagree, we review our estimate and evaluate any evidence they provide supporting a different estimate. If we find the evidence persuasive, we adjust the preliminary estimate accordingly. The estimates are finalized on October 15th for all of the state’s 67 counties and more than 400 incorporated cities. These final estimates are then used in the Department of Revenue’s revenue distribution formula for the next July 1st distribution (15 months after the April 1st estimate).
There are real people behind every number we produce and we do everything we can to make sure that our estimates are as accurate as possible.
There are real people behind every number we produce and we do everything we can to make sure that our estimates are as accurate as possible. Take Okaloosa County, for example. In 2011, more than 6,500 soldiers in an Army Special Forces Group relocated from North Carolina to Florida, along with their family members. This caused a sudden change in the population that was not picked up by our normal data sources. After being notified about this relocation, we adjusted our preliminary 2012 population estimate substantially. As Okaloosa County Commissioner Dave Parisot put it, “It was essential that this population be duly noted and recorded due to its impacts on revenue sharing, school populations, the real estate and housing markets, and other economic development factors.” The Army Public Affairs Officer worked with UF demographers to, according to Parisot, “timely and accurately adjust the populations of Okaloosa County and our cities.”
The final estimates for 2013 are available on our website at http://www.bebr.ufl.edu/population