- Ying Wang, Ph.D.
- Stefan Rayer, Ph.D.
Migration from abroad has been an important source of population growth for the United States. Due to geographic proximity, the United States is a major destination for foreign in-migrants from the Americas—other countries in North, Central, and South America. This article aims to compare foreign in-migration patterns from the Americas to the United States and its four largest states—California, Florida, New York and Texas—since 2005.
Table 1 displays the percentage of foreign in-migrants from the Americas out of total foreign in-migrants to the United States and the four states since 2005. At the national level, in 2005 almost half (44%) of all foreign in-migrants came from the Americas. That percentage has dropped since then to 29% in 2012, before rising again slightly to 32% by 2015. California, New York, and Texas also recorded declines over that time period.
Table 1. Percentage of Foreign In-Migrants from the Americas out of Total In-Migrants from Abroad to the United States, California, Florida, New York, and Texas
| 2005 | 2006 | 2007 | 2008 | 2009 | 2010 | 2011 | 2012 | 2013 | 2014 | 2015 | |
| U.S. | 44.3 | 40.2 | 36.7 | 34.7 | 33.1 | 31.5 | 31.7 | 29.2 | 29.5 | 31.7 | 31.8 |
| CA | 50.1 | 44.0 | 38.3 | 36.2 | 32.0 | 27.4 | 25.2 | 24.1 | 26.9 | 27.3 | 26.4 |
| FL | 65.4 | 66.5 | 64.8 | 62.0 | 63.2 | 66.8 | 60.4 | 63.9 | 66.3 | 65.7 | 67.7 |
| NY | 40.4 | 36.3 | 29.8 | 31.2 | 34.6 | 34.5 | 31.9 | 28.7 | 28.8 | 33.9 | 29.4 |
| TX | 58.3 | 57.8 | 52.5 | 48.7 | 49.4 | 42.5 | 52.5 | 47.6 | 42.0 | 44.3 | 43.8 |
The biggest declines were in California. Whereas about half of all foreign in-migrants to the state came from the Americas in 2005, since 2010 only between a quarter and a third have come from that part of the world. New York and Texas also recorded significant declines of about 10–15 percentage points between 2005 and 2015.
The declining share of migrants from the Americas has largely been compensated by an increase in in-migration from Asian countries. For example, in 2015, Asian in-migrants accounted for approximately 53% of all foreign in-migrants to California and 32% to Texas (data not shown). In contrast to the declines seen in California, New York, Texas, and the nation overall, the percentages of in-migrants from the Americas to Florida have remained relatively stable over time, fluctuating between 60% and 68%, with no clear trend. We note that the percentages of in-migrants from the Americas have been substantially higher for Florida than for the nation and the three other large states.
Figures 1–5 show the numbers and percentages of foreign in-migrants from the Americas by specific origin. We grouped migrants into the following six countries or regions of origin: Canada, the Caribbean excluding Cuba, Central America, Cuba, Mexico, and South America. Nationwide, the total number of foreign in-migrants from the Americas declined from about 750,000 in 2005 to just over 500,000 in 2012 (see Figure 1); it has gone up moderately since then, exceeding 600,000 in 2014 and 2015.
Figure 1. Foreign In-Migrants from the Americas to the United States

Mexico has been the leading origin country to the United States throughout this period, but the percentage of foreign in-migrants from the Americas who came from Mexico has declined gradually over time, from more than half in 2005 to only around one-third in 2015. Migrants from Cuba constituted the smallest of the six groups, but their share has been increasing slightly; had we included Cuba with the Caribbean, this would have been the second largest flow in most years. The share of in-migrants from Central America has remained relatively stable, while it increased somewhat for migrants from South America and Canada.
Similar to the United States, the total inflow from the Americas to California was highest in 2005, then declined until 2012, before recovering somewhat since then (see Figure 2). In 2005, Mexican migrants comprised more than 70% of total foreign in-migrants from the Americas to California; this percentage had dropped to below 50% by 2015.
Figure 2. Foreign In-Migrants from the Americas to California

Figure 3 shows that Florida did not experience such a large decline in the level of foreign in-migration from the Americas—the total number fluctuated between 2005 and 2011, with no clear up or down pattern, and it has increased since then. The leading countries or regions of origin also differ for Florida. Compared to the nation and California, migrants from the Americas to Florida have come primarily from South America, Cuba, the Caribbean, and Canada, while flows from Mexico and Central America have been of lesser importance. Furthermore, the origins of Florida’s foreign in-migrants are more dispersed, with no country or region dominating such as Mexicans in California.
Figure 3. Foreign In-Migrants from the Americas to Florida

Figure 4 displays the flow patterns to New York State. New York had the smallest total number of foreign in-migrants from the Americas compared with the other three states, fluctuating between about 40,000 and 50,000 per year since 2005. In terms of origins, migrants from the Americas to New York came primarily from the Caribbean, followed by those from South America.
Figure 4. Foreign In-Migrants from the Americas to New York

The pattern of the overall flows to Texas is most similar to that of California and the nation, showing declines in overall numbers from 2005 to 2010, and a smaller recovery since then (see Figure 5). Furthermore, similar to California and the nation, the inflows to Texas are dominated by Mexicans. Approximately 80% of the total foreign in-migrants from the Americas to Texas were from Mexico in 2005; that percentage has dropped greatly since then, amounting to just over 44% in 2015. While Mexicans still form the largest origin group, the inflows from the Americas to Texas have diversified over time, with migrants from Central and South America taking up a larger share of the total in recent years.
Figure 5. Foreign In-Migrants from the Americas to Texas

Figures 6–11 compare the flow patterns from the Americas to the four states by region or country of origin. In each year since 2005, Florida received the most foreign in-migrants from Canada, as shown in Figure 6. The flow of Canadian migrants to Florida comprised around 20% of all Canadian migrants to the United States, peaking at about 25% in 2013. California ranked second, with comparatively fewer Canadian migrants moving to New York and Texas. Many of the Canadian migrants to the United States are retirees, especially those who move to the Sun Belt states.
Figure 6. Foreign In-Migrants from Canada
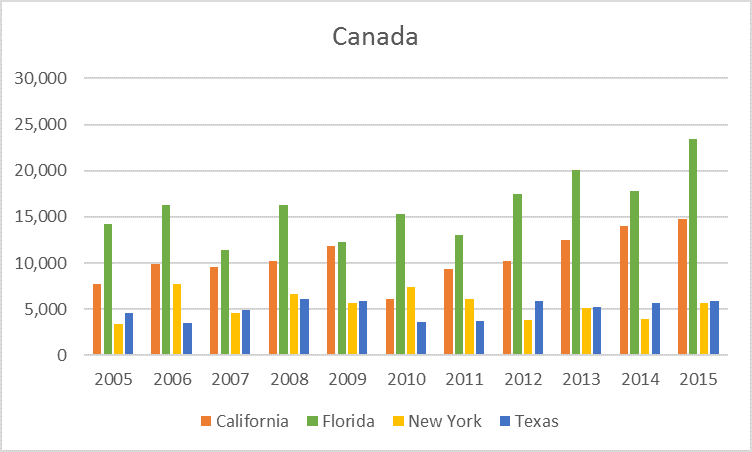
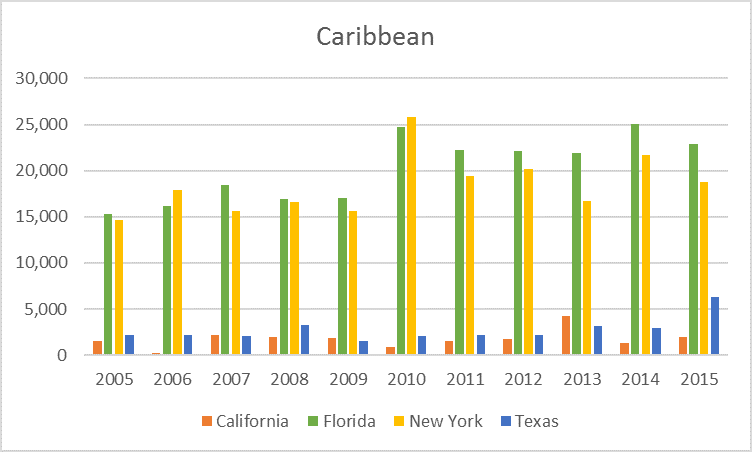
Figure 7 illustrates that most of the foreign in-migrants from the Caribbean region made their way to Florida and New York. These two states accounted for more than half of all Caribbean migrants in the United States.
Figure 7. Foreign In-Migrants from the Caribbean
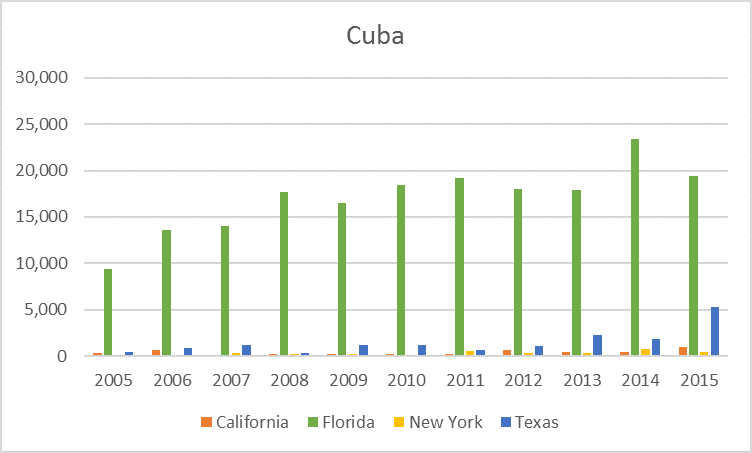
In contrast, migrants from Central America primarily went to California and Texas (see Figure 8), though in some years Florida was also a major destination. Figure 9 shows that the overwhelming majority of Cuban migrants moved to Florida, which has been an established pattern for many years; it reflects geographic proximity and the presence of a large population of persons of Cuban origin already living in the state.
Figure 8. Foreign In-Migrants from Central America
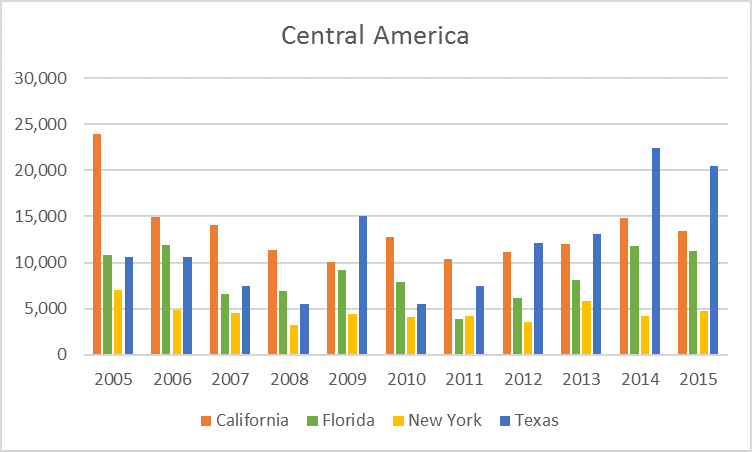
Figure 9. Foreign In-Migrants from Cuba
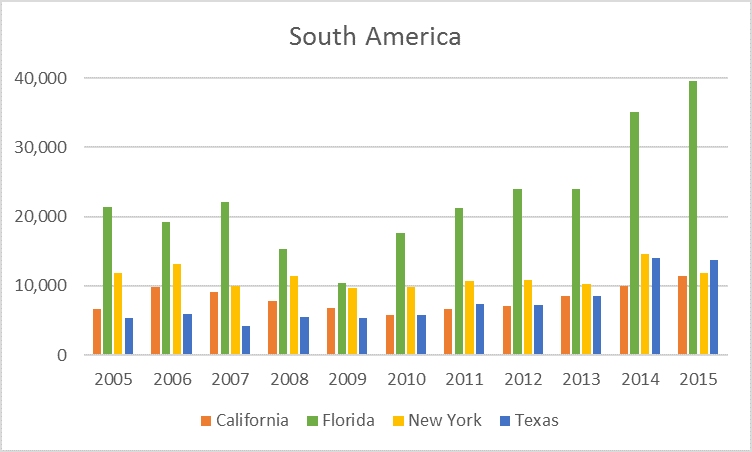
The flows of Mexican migrants, although they have been declining over time, are still larger than those of the other origin groups (see Figure 10). A large majority of foreign in-migrants from Mexico went to California and Texas. Finally, Figure 11 demonstrates that Florida has been the primary destination for migrants from South America among the four states, with the size of the inflow almost doubling between 2005 and 2015.
Figure 10. Foreign In-Migrants from Mexico
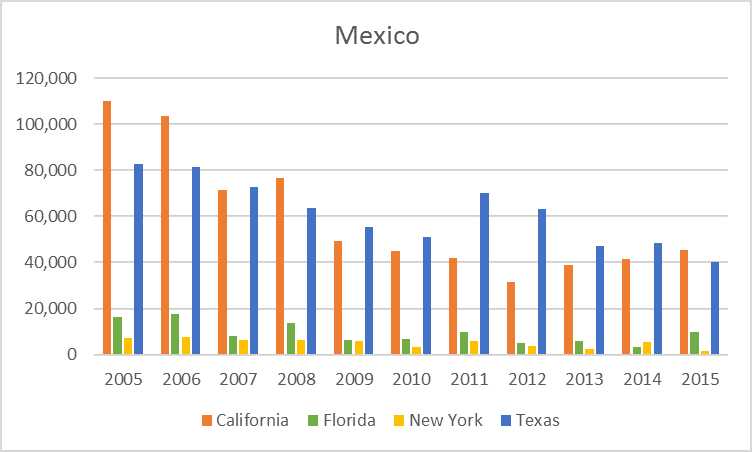
Figure 11. Foreign In-Migrants from South America
This analysis has shown how migration flows from other countries in the Americas to the United States have fluctuated since 2005. We further highlighted flows to the four largest states—California, Florida, New York, and Texas—and presented shifts in the origins of foreign in-migrants from the Americas at both the national level and for the four states. Although only one component of total population change, the foreign in-migration from other countries in the Americas has been an important contributor to demographic change in the United States and its four largest states.
NOTE: Foreign in-migration in this article refers to migrants from abroad, excluding those from Puerto Rico and the U.S. Island Areas. The data come from Public Use Microdata Sample (PUMS) 1-year files of the American Community Survey (ACS) from 2005 to 2015.

