- Stefan Rayer, PhD
- Ying Wang, PhD
Population density provides information about the spatial distribution of the population. Density can be computed for various types of areas such as states, counties, cities, zip code areas, or census blocks. The intent of this article is to map and investigate the population density of counties in Florida using four different population density measures, and to show how density can vary depending on the measure used in its calculation. All population data used in this analysis come from Census 2010.
The most commonly used way to calculate population density is to divide the total population of an area by the total land area. Figure 1 shows the population density per square mile of total land area of counties in Florida for 2010. Population density ranged from 10 persons per square mile in Liberty County to 3,348 persons per square mile in Pinellas County. Many of the state’s most densely populated counties are located in the southeast (Miami-Dade and Broward counties), in central Florida (Seminole and Orange counties), and along the Atlantic and Gulf coasts (Duval, Hillsborough, Pinellas, and Lee counties).
Figure 1. Population density per square mile for Florida counties using total land area, 2010
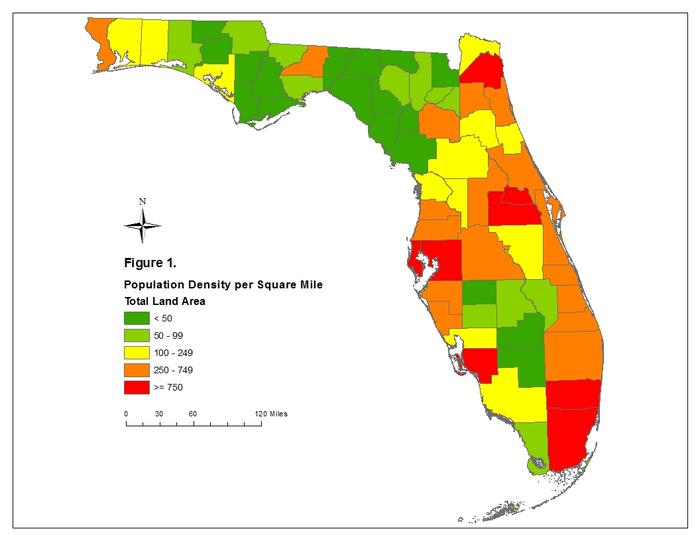

Calculating population density this way is straightforward, but can be misleading, because nonresidential land covers such as forests, parks, and wetlands, and nonresidential land uses including agricultural and commercial areas are included in the calculation. Since these types of areas are mostly uninhabited, including them when calculating population density understates the true density of the areas where people live. Consequently, a more accurate way of measuring population density would be to exclude the land area taken up by nonresidential land covers and land uses. To do so, we extracted data for the smallest geographic area for which census data are available, the census block. In Census 2010, there were 484,481 census blocks in Florida; of these, 183,972 census blocks (38%) had no people living in them. We recalculated population density by excluding the land area of all census blocks with zero population in each county. That is, only the land area of census blocks with at least one person enumerated in Census 2010 is included in our second measure of population density. While this still includes some types of nonresidential areas, it more accurately reflects the density of the areas where people live. Statewide, just under two thirds of the total land area is made up of census blocks with nonzero population. This varies widely by county, ranging from under 30% in Franklin, Gulf, Monroe, Palm Beach, and Broward counties to over 90% in Jackson, Holmes, and Suwannee counties. The smaller the ratio, the more population density increases under this measure.
Figure 2 shows the population density of counties in Florida excluding the land area of census blocks with zero population; the density cut-off points are the same as in Figure 1. Population densities of all 67 counties in Florida increased after eliminating zero population blocks. Glades County emerges as the state’s least densely populated county with only 24 persons per square mile, whereas Broward County has the highest density of 5,070 persons per square mile. Another three counties (Palm Beach, Sarasota and St. Lucie) move up into the top density category of greater than 750 persons per square mile. Only eight counties remain in the least densely populated category (less than 50 persons per square mile), compared with 18 counties using the measure of total land area shown in Figure 1.
Figure 2. Population density per square mile for Florida counties excluding census blocks with zero population, 2010

So far, we measured population density for the whole county, using two different land area specifications in the denominator. Population density, however, also varies dramatically among census blocks within a county. We next calculate two additional measures of density: the median density per census block, and the 95th percentile density per census block. The former provides a measure of the average population density at the smallest level of census geography; the latter indicates how dense the urban cores are. Figure 3 shows the median population density per census block for counties in Florida; it ranges from 72 persons per square mile in Holmes County to 8,343 persons per square mile in Miami-Dade County. These densities are much higher than the county-wide densities shown in Figures 1 and 2.
Figure 3. Population density per square mile for Florida counties using median census block density, 2010
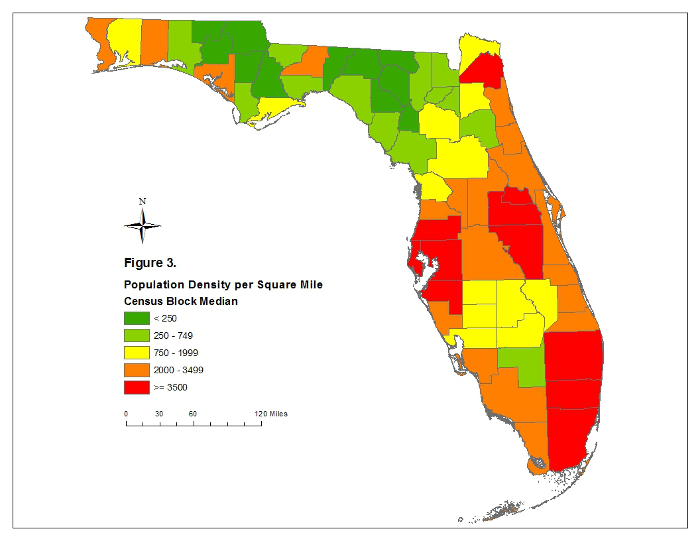

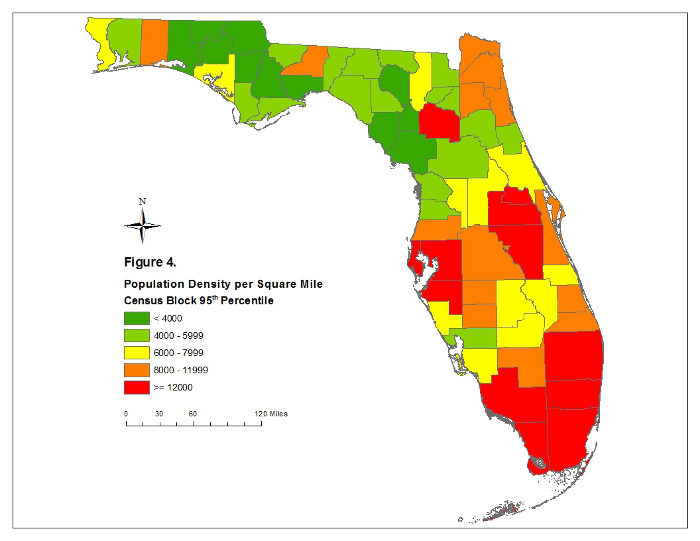
Figure 4 depicts population density at the 95th percentile for census blocks. Liberty County has the state’s least densely populated urban cores according to this measure (2,495 persons per square mile), whereas Miami-Dade County still has the highest (31,550 persons per square mile). Counties with the most densely populated urban cores are located in the southern and central regions of the state, along the Atlantic coast, and the Gulf coast from the Tampa Bay area southwards. Alachua County for the first time moves into the top density category, having a density of 12,481 persons per square mile at the 95th percentile due to its highly concentrated college population.
Figure 4. Population density per square mile for Florida counties using 95th percentile census block density, 2010

As a final comparison, Table 1 lists the top ten most densely populated counties in Florida using the aforementioned four measures. The top ten counties in population density calculated excluding the land area of zero population census blocks are the same as those calculated using total land area, though the rankings within the top ten shift. The density of several counties increases significantly, especially for Miami-Dade, Broward, and Palm Beach counties; in these three counties the Everglades natural region encompasses more than half of each county’s total land area. The population density rises from 670 persons per square mile (rank 10) to 2,325 persons per square mile (rank 4) in Palm Beach County; from 1,315 persons per square mile (rank 4) to 3,639 persons per square mile (rank 3) in Miami-Dade County; and from 1,445 persons per square mile (rank 2) to 5,070 persons per square mile (rank 1) in Broward County.
When using the other two measures of census block-related density, the rankings get reshuffled once again. Manatee and Pasco counties join the top ten based on median census block density, while Lee and Sarasota counties drop out. Monroe, Osceola and Collier counties join the top ten based on census block density at the 95th percentile. Miami-Dade and Broward counties are ranked first and second according to both measures, indicating that these counties have census blocks with very high densities. One of the most dramatic shifts occurs for Monroe County, which ranked 42nd and 32nd on the first two density measures, but moved up all the way to fourth place on this final density measure. This is a reflection that much of the county’s population resides in geographically confined areas in the Florida Keys. Conversely, Duval County drops out of the top ten, and Pinellas County ranks much lower than on the other three density measures.
Table 1. Density Measures and Rank

Note:Density is measured per square mile; 1 density computed using total land area; 2 density computed excluding the land area of zero population census blocks; 3 density computed using census block median; 4 density computed using census block 95th percentile. Source: Census 2010.
Which of these measures of population density most accurately reflects true density? We believe that refinements such as excluding census blocks with zero population make comparisons among counties more meaningful, since counties vary widely in the proportion of total land area taken up by nonresidential land covers and land uses. Furthermore, calculating density at the smallest level of census geography – the census block – whether done through the median or a specific percentile, allows for additional comparisons to be made. However, the census block data required for the calculation of such refined density measures are only available from the decennial census, whereas the standard density calculation can be updated with each new population estimate. Thus, there is no clear-cut answer to the question of which density measure is best. Each measure reflects a different aspect of density. Together, these measures of population density help us better understand the spatial distribution of population in Florida.