Publication Date:
- Stanley K. Smith, Ph.D
The baby boom refers to the huge number of births occurring in the United States from the mid-1940s to the mid-1960s. Its magnitude and duration caught virtually everyone by surprise. Although it was not surprising that birth rates rose for a year or two after the end of World War II, it was very surprising that they kept rising throughout the 1940s and most of the 1950s. The total fertility rate (the average number of births per woman if current age-specific rates remained constant) rose from 2.5 in the mid-1940s to almost 3.8 in 1957 and remained above 3.0 well into the 1960s. Nationally, the number of births rose from 2.7 million in 1945 to 4.3 million in 1957 and remained above 4 million through 1964. A total of 77.6 million babies were born in the United States between 1945 and 1964.
Florida experienced its own baby boom. The number of births rose from 47,791 in 1945 to 116,683 in 1961 and remained near that level through 1964. More than 1.7 million babies were born in Florida between 1945 and 1964.
What caused the baby boom? Numerous explanations have been given, including rising incomes, changes in the ratio of male to female wages, and a return to “normalcy” following a long period of economic depression and war. Whatever the cause, it produced a huge generation that has had a tremendous impact on many aspects of life in Florida and the nation as a whole. In this report, we discuss the impact of the baby boom on Florida’s age structure. For simplicity, we define the baby boom as all births occurring between 1945 and 1964. This differs slightly from the usual definition of 1946-1964 but allows us to break the baby boom into four time periods of equal length (1945-49, 1950-54, 1955-59, and 1960-64), facilitating the analysis of historical trends and projected future changes.
Table 1 shows the number of baby boomers and their proportion of the total population each decade between 1950 and 2050 for Florida and the United States. Numbers for 1950-2010 are census counts and numbers for 2020-2050 are projections based on historical trends. The 1950 census included only the first five years of the baby boom and the 1960 census included only the first 15 years; the 1970 census was the first to include all 20 years. The number of baby boomers in the United States grew from 16.2 million in 1950 to 77.3 million in 1970. Due to foreign immigration, the number continued growing through 2000 (to 82.8 million) before falling slightly in 2010 (to 81.5 million). It is projected to continue falling through 2050, as the higher mortality rates associated with old age take their toll on an aging population.
Table 1. Baby Boomers and Total Population, Florida and the United States, 1950-2050
| Year | Florida | United States | ||||
| Boomer Population | Total Population | PercentOf Total | Boomer Population | Total Population | PercentOf Total | |
| 1950 | 291 | 2,771 | 10.5 | 16,164 | 150,697 | 10.7 |
| 1960 | 1,467 | 4,952 | 29.6 | 55,786 | 179,323 | 31.1 |
| 1970 | 2,322 | 7,789 | 34.2 | 77,307 | 205,052 | 37.7 |
| 1980 | 3,034 | 9,746 | 31.1 | 79,569 | 226,546 | 35.1 |
| 1990 | 3,921 | 12,938 | 30.3 | 80,619 | 248,791 | 32.4 |
| 2000 | 4,555 | 15,982 | 28.5 | 82,826 | 281,422 | 29.4 |
| 2010 | 5,079 | 18,801 | 27.0 | 81,489 | 308,746 | 26.4 |
| 2020 | 5,302 | 21,185 | 25.0 | 75,560 | 333,896 | 22.6 |
| 2030 | 5,174 | 23,785 | 21.8 | 63,828 | 358,471 | 17.8 |
| 2040 | 4,057 | 25,970 | 15.6 | 44,255 | 380,016 | 11.6 |
| 2050 | 1,823 | 27,934 | 6.5 | 17,979 | 399,803 | 4.5 |
Sources: 1) BEBR, unpublished population projections (medium series). 2) U.S. Census Bureau, decennial population counts 1950-2010. 3) U.S. Census Bureau, 2012 National Population Projections. Washington DC, 2012.
Note: Numbers are in thousands.
Fueled by in-migration, the number of baby boomers has grown more rapidly in Florida than the rest of the United States, rising from 291,000 in 1950 to 2.3 million in 1970 and 5.1 million in 2010. According to our medium projections, the number will continue rising through the mid-2020s before starting to decline as deaths of baby boomers increase relative to the number of baby boomers moving to the state. The number of baby boomers in Florida is projected to reach 5.3 million in 2020 before falling to 5.2 million in 2030, 4.1 million in 2040, and 1.8 million in 2050.
In spite of rapid growth, the numerical dominance of baby boomers relative to other generations has been declining over time. Baby boomers accounted for 34.2% of Florida’s population in 1970, 30.3% in 1990, and 27% in 2010. They are projected to account for 21.8% in 2030 and 6.5% in 2050. For the nation as a whole, baby boomers accounted for 37.7 percent of the total population in 1970, 32.4% in 1990, and 26.4% in 2010; they are projected to account for 17.8% in 2030 and only 4.5% in 2050. It is noteworthy that baby boomers accounted for a smaller share of Florida’s population than the national population from 1950 to 2000, but accounted for a larger share in 2010. This shift was caused by the large numbers of baby boomers moving to Florida in recent decades. Baby boomers will continue to account for a larger proportion of the total population in Florida than the United States through 2050.
The baby boom had a tremendous impact on the age structure in Florida and the United States. Age structure refers to the distribution of a population across age groups. It can be depicted graphically with age pyramids, which show the number or proportion of the population accounted for by each age/sex group at a given point in time. Comparing pyramids for a number of years provides insight regarding how the age structure is changing over time. Figure 1 shows age pyramids for Florida’s population every 10 years from 1950 to 2050. The bars represent the proportion of total population in each age/sex group at a given point in time. The baby boom generation is highlighted in each pyramid.
Figure 1. Age Pyramids, Florida, 1950-2050
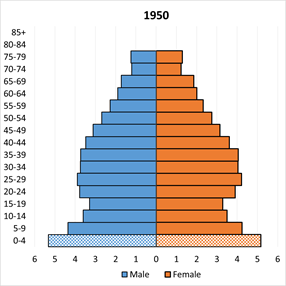
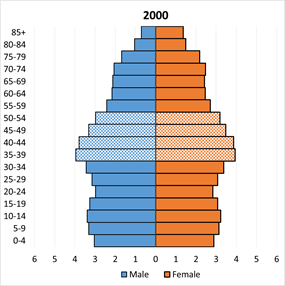
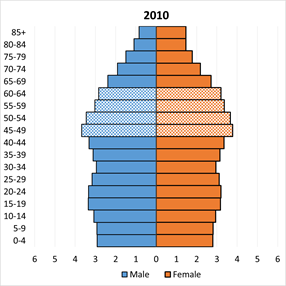
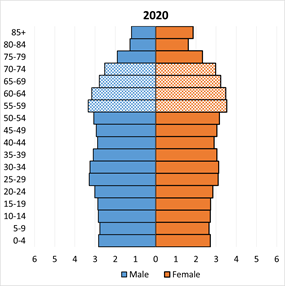
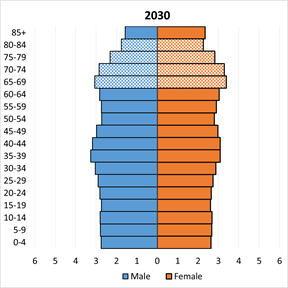
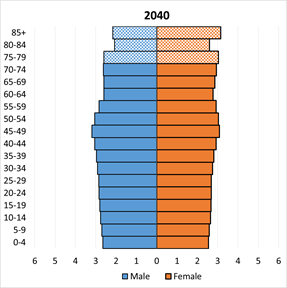
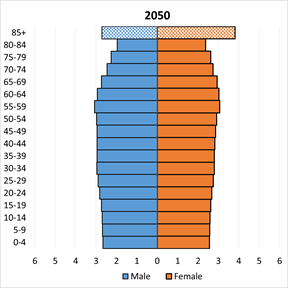
Sources: 1) U.S. Census Bureau, decennial censuses (1950-2010). 2) BEBR, unpublished population projections (2020-2050).
Note: These diagrams show the proportion of the population in each age/sex group. Baby boom groups are highlighted in each diagram.
The 1950 pyramid encompasses only the first five years of the baby boom (those born between 1945 and 1949) but the 0-4 age group is the largest of any age group. The small number of births during the 1930s is reflected by the small proportions of the population aged 10-14 and 15-19. It should be noted that the 75-79 age group appears unusually large because it includes all persons above the age of 75 (breakdowns for ages 80-84 and 85+ were not available in 1950). It should also be mentioned that Florida’s age structure was very similar to that of the United States as a whole in 1950; large numbers of retirees had not yet started moving to Florida.
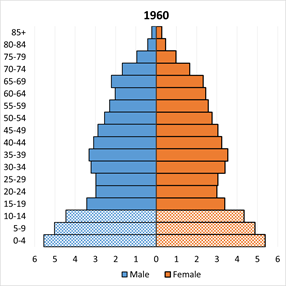
The 1960 pyramid includes the first 15 years of the baby boom. The three youngest groups are by far the largest, reflecting the large and increasing numbers of births between 1945 and 1959. The small number of births during the 1930s is again apparent (ages 20-24 and 25-29). Full data for the oldest groups were available in 1960, providing the more typical shape of a population pyramid.
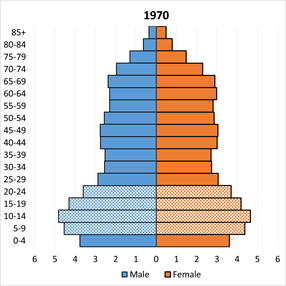
The 1970 pyramid is the first to encompass the entire baby boom. The 10-14 age group (born 1955-1959) is the largest, followed by ages 5-9 (born 1960-1964) and 15-19 (born 1950-1954). The first wave of baby boomers (born 1945-1949), however, is slightly smaller than the first post-boom group (born 1965-1969).
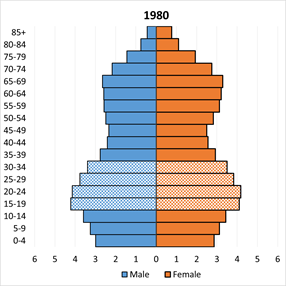
The aging of baby boomers can be seen as the decades go by. By 2010, ages 45-49 and 50-54 (born 1960-1964 and 1955-1959, respectively) are the two largest groups in Florida. Projections for 2020-2050 show the continued aging of that generation, with rising proportions of the population in their 60s, 70s, and 80s. The size of the oldest age group in 2050 is particularly striking; this is the first year in which all baby boomers will be aged 85 or older (if they are still alive).
The demographic impact of the baby boom can scarcely be overstated, either in Florida or the United States as a whole. It produced huge numbers of children in the 1950s and 1960s, of young adults in the 1970s and 1980s, and of middle-aged adults in the 1990s and 2000s. These shifts in age structure have led to dramatic shifts in the demand for schools, housing, and many other types of goods and services and have contributed to the changes in social norms, cultural attitudes, and political behavior that have been observed over the past half century.
The greatest impact, however, may be yet to come—especially in retirement states such as Florida. The huge national increase in the number of people in their 50s, 60s, and 70s over the next several decades will lead to substantial increases in the number of older persons moving to Florida. As shown in Table 2, we are projecting large increases in Florida’s older population between 2010 and 2050. The proportion aged 65+, which fluctuated between 17 and 18% between 1990 and 2010, is projected to increase to 21.7% by 2020, to 25.7% by 2030, and to 26.6% by 2050. The population aged 65+ is projected to grow from 3.3 million in 2010 to 6.1 million in 2030 and 7.4 million in 2050; the population aged 85+ is projected to grow from 434,000 in 2010 (2.3% of the total population) to 934,000 in 2030 (3.9% of the total) and 1.8 million in 2050 (6.5% of the total).
Table 2. Florida Population by Age, 2010-2050, Medium Projection Series
| Age | 2010 | 2020 | 2030 | 2040 | 2050 | |||||
| Number | % | Number | % | Number | % | Number | % | Number | % | |
| <15 | 3,284,608 | 17.5 | 3,493,251 | 16.5 | 3,884,584 | 16.3 | 4,129,409 | 15.9 | 4,405,682 | 15.8 |
| 15‒44 | 7,177,939 | 38.2 | 7,651,976 | 36.1 | 8,327,208 | 35.0 | 8,818,210 | 34.0 | 9,440,904 | 33.8 |
| 45‒64 | 5,079,161 | 27.0 | 5,444,585 | 25.7 | 5,465,198 | 23.0 | 6,104,572 | 23.5 | 6,649,186 | 23.8 |
| 65‒84 | 2,825,477 | 15.0 | 3,949,135 | 18.6 | 5,173,744 | 21.8 | 5,538,602 | 21.3 | 5,615,613 | 20.1 |
| 85+ | 434,125 | 2.3 | 646,529 | 3.1 | 934,440 | 3.9 | 1,379,695 | 5.3 | 1,822,749 | 6.5 |
| Total | 18,801,310 | 100.0 | 21,185,476 | 100.0 | 23,785,174 | 100.0 | 25,970,488 | 100.0 | 27,934,134 | 100.0 |
Source: BEBR, unpublished population projections.
The large increases in Florida’s older population will have a substantial impact on demands for healthcare, housing, transportation, and many other types of goods and services. Will supplies keep pace with shifting demands? Will baby boomers save enough to support themselves during retirement? Will families be able to care for aging parents and grandparents? Will state and local governments adopt policies that meet the needs of an aging population? Will federal programs like Social Security and Medicare provide adequate funding? The future quality of life for many Floridians will depend on the answers to these questions.
POSTED: February 25, 2015