Publication Date:
- Ying Wang, PhD, Research Demographer, Bureau of Economic and Business Research.
- Stefan Rayer, PhD, Population Program Director, Bureau of Economic and Business Research.
Due to geographic proximity and sizable Puerto Rican communities already present in the state, Florida has become a primary destination for in-migrants from Puerto Rico in recent years. Following a brief exposition of decennial census counts for 2000 and 2010, this article examines various aspects of Puerto Rican population growth in Florida – as well as for some other states – focusing especially on migration patterns; we also discuss some county-level patterns. The primary data source we use in this article includes 1-year estimates from the American Community Survey (ACS) from 2005 to 2016 as well as data from the 1-year Public Use Microdata Sample (PUMS) files of the ACS for those years. We close with comments about recent inflows from Puerto Rico to Florida following Hurricane Maria.
Table 1. Puerto Rican Population in the United States, Puerto Rico, and the Top Five States
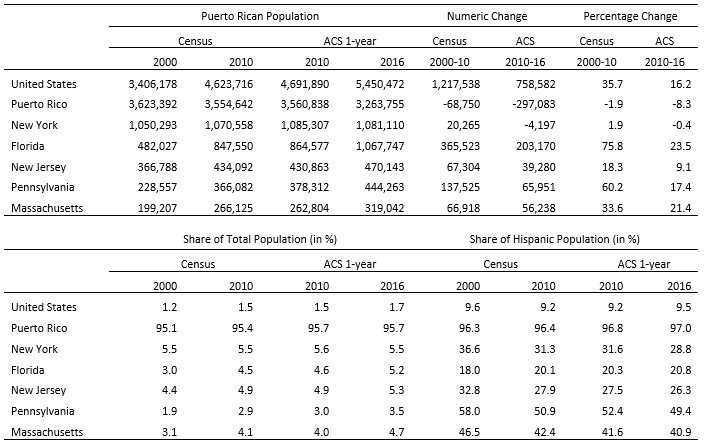
Table 1 shows that the number of Puerto Ricans living in the United State has increased by about 1.2 million (36%) between 2000 and 2010, while it decreased slightly in Puerto Rico. For comparison, Table 1 also displays the 1-year ACS estimates for 2010; while not identical, the 2010 1-year ACS estimates are generally quite close to the 2010 decennial census counts. For the United States, the 2000–2010 trend continued in 2010–2016, with the Puerto Rican population growing by another 750,000 (16%). The population declines accelerated in Puerto Rico, with the island’s population shrinking by about 300,000 (8%) since 2010. Among states, New York still has the largest resident population of Puerto Ricans, but it has hardly changed since 2000. In contrast, the Puerto Rican population living in Florida has grown rapidly since 2000, increasing by about 365,000 (76%) from 2000 to 2010, and by another 200,000 (24%) from 2010 to 2016. Other states with sizeable Puerto Rican populations include New Jersey, Pennsylvania, and Massachusetts; in all three states the Puerto Rican population increased more rapidly than in New York, though not as fast as in Florida. By 2016, about 3.38 million Puerto Ricans lived in the top 5 states, representing about 62% of all Puerto Ricans living on the U.S. mainland (the lower 48 states), Alaska, and Hawaii.
The bottom panel of Table 1 shows the shares of the Puerto Rican population of total population and of the Hispanic population. Between 2000 and 2016, the Puerto Rican share of total population increased for the nation overall as well as in Florida, Massachusetts, New Jersey, and Pennsylvania; it showed little change in New York. The Puerto Rican share of the Hispanic population increased only in Florida; it stayed about the same nationwide, and decreased in the other four states. The decreasing shares of Puerto Ricans among all Hispanics in New York, New Jersey, Pennsylvania, and Massachusetts mean that other Hispanic origin groups grew comparatively faster than the Puerto Rican population in those states.
Inflows from Puerto Rico
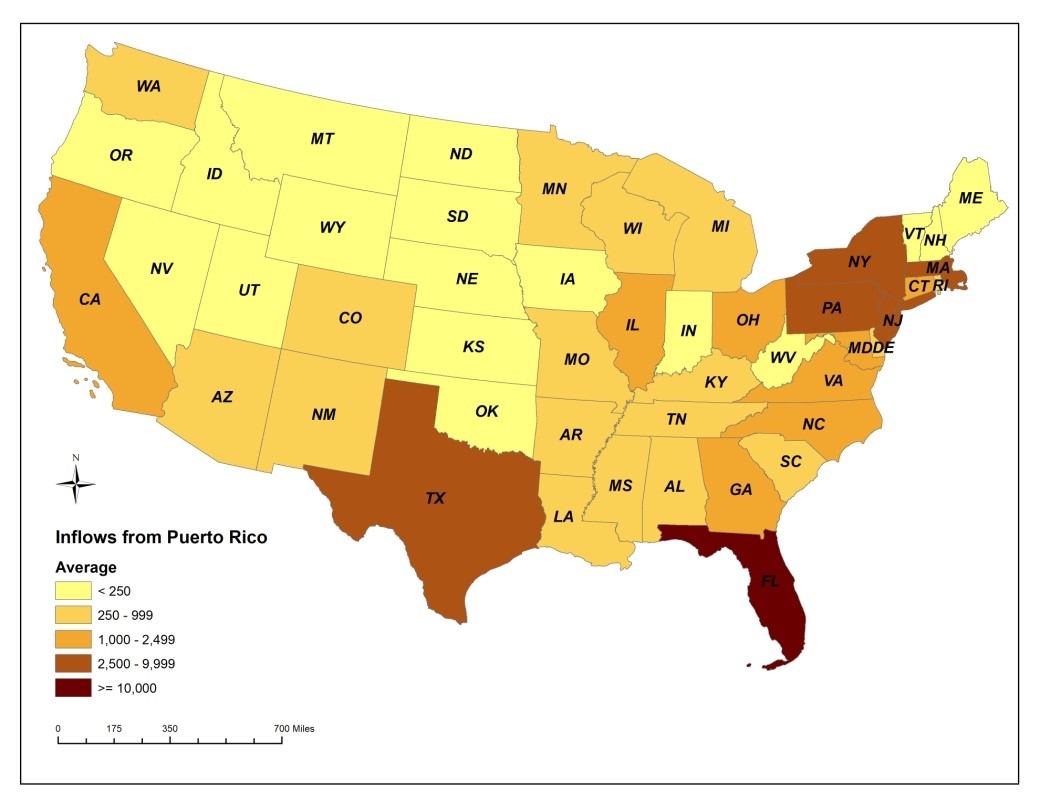
We next examine the migration destinations of Puerto Ricans who moved to the United States mainland between 2005 and 2016. Figure 1 displays the average annual flows from Puerto Rico to each state over that period and gives us a picture of the geographic dispersal of the Puerto Rican migrants. Florida attracted the largest inflow from Puerto Rico. Other states with large inflows include several Northeastern states (New York, New Jersey, Pennsylvania, and Massachusetts), and Texas. In general, states east of the Mississippi recorded larger inflows than those in the western U.S., reflecting geographic proximity and earlier settlement patterns of the Puerto Rican population stateside.
Figure 1. Average Annual Inflows from Puerto Rico to the Continental United States,
2005–2016
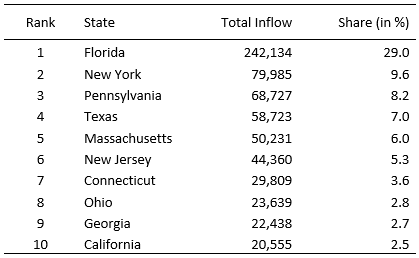
As shown in Table 2, Florida’s share (29%) of the total inflow from Puerto Rico to the United States between 2005 and 2016 far exceeded that of any other state. In fact, Florida’s share was almost as large as the combined inflows to New York, Pennsylvania, Texas, and Massachusetts. New York still has the largest population of Puerto Ricans on the mainland (see Table 1). However, because of the much faster growth of the Puerto Rican population living in Florida, as well as that of several other states, New York’s share of Puerto Ricans living in the United States has been declining over time, from about 31% in 2000 to 20% by 2016 (data not shown). Given these trends, it is possible that the 2017 ACS 1-year estimates, which are scheduled to be released in the fall of 2018, will show that Florida has become the state with the largest Puerto Rican population living on the mainland (see also the discussion about Hurricane Maria below).
Table 2. The Top 10 Destination States for Migrants from Puerto Rico to the
United States, 2005–2016
Next, we focus in more detail on the migration flows from Puerto Rico to Florida. Figure 2 depicts the annual inflows from Puerto Rico to Florida between 2005 and 2016; these ranged from about 11,400 in 2005 to 24,000 in 2016, peaking at just over 31,000 in 2014. Although the 1-year ACS estimates fluctuate from year to year, the overall trend is upwards. In addition, the figure shows Florida’s share of total inflows to the United States from Puerto Rico; it ranged from 24% (in 2010) to 36% (in 2014) over the period.
Figure 2. Annual Inflows from Puerto Rico to Florida, 2005–2016
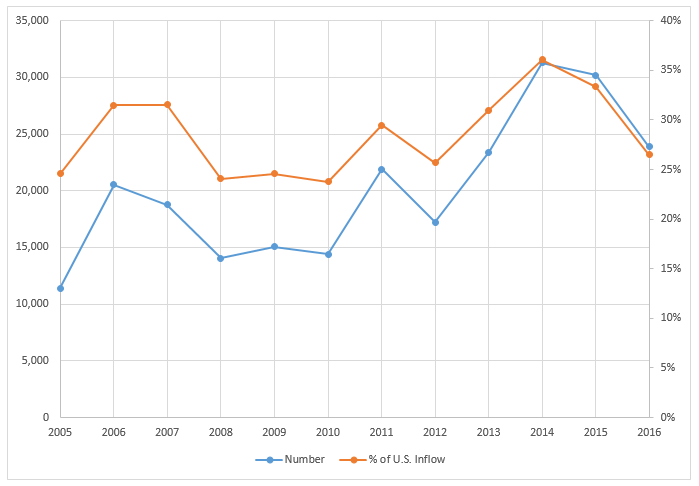
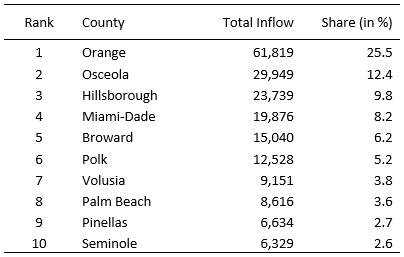
Figure 3 makes clear that migrants from Puerto Rico predominantly settled in Central and South Florida; the majority of counties in North Florida, in contrast, received fewer than 100 migrants on average per year. In fact, more than two thirds of all migrants from Puerto Rico to Florida moved to Central Florida, followed by South Florida (about 20%). Puerto Ricans are attracted to Central Florida due to the large population of Puerto Ricans already living in the area; the education system, job opportunities, and relatively inexpensive housing are further attractors. Orange County recorded the largest inflow of Puerto Ricans of all Florida counties between 2005 and 2016, as shown in Figure 3 and Table 3, followed by Osceola and Hillsborough counties. Rounding out the top five are Miami-Dade and Broward counties in South Florida.
Figure 3. Average Annual Inflows from Puerto Rico to Florida Counties, 2005–2016
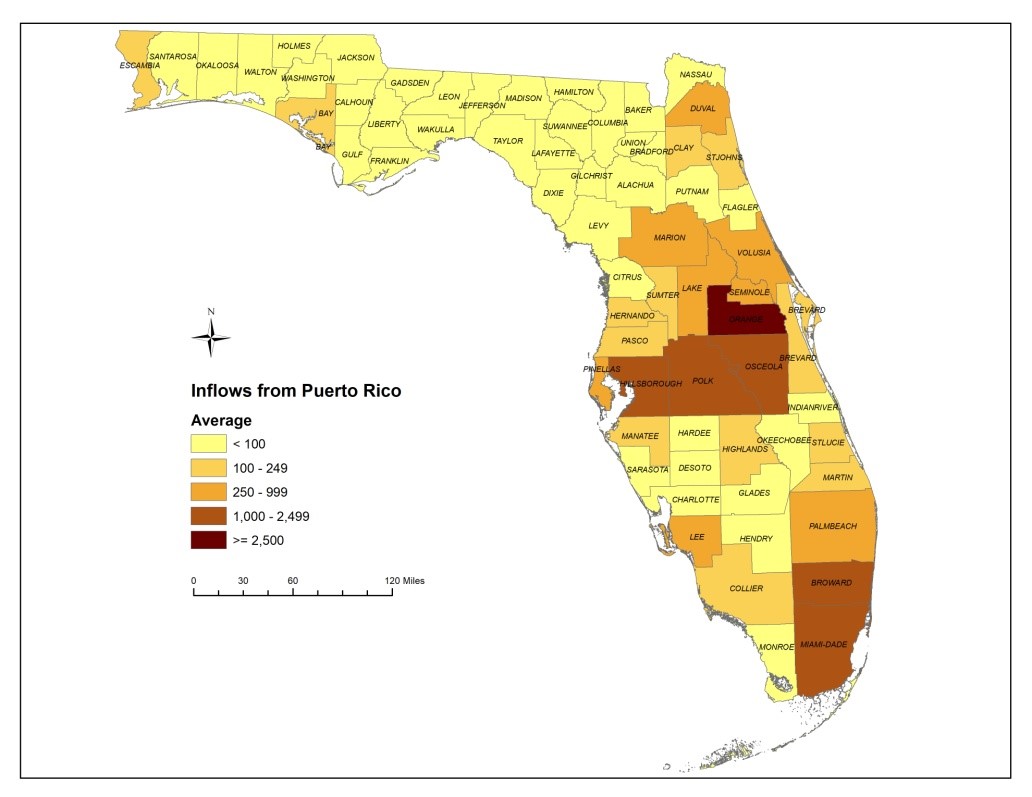
2005–2016
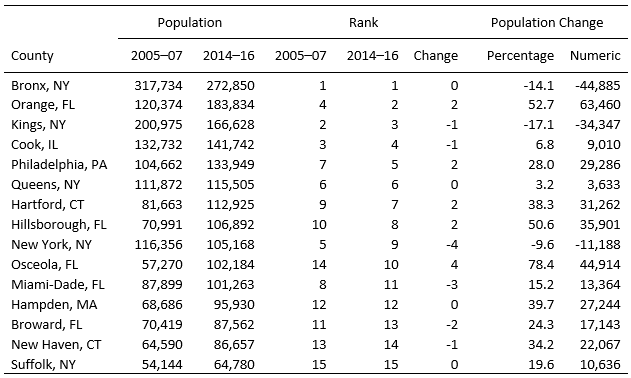
Turning from Florida to the nation, Table 4 displays the 15 counties in the United States with the largest populations of Puerto Rican residents. Since the 1-year ACS estimates can fluctuate from year-to-year, we averaged three years of data to provide more stable results. We note that these are not identical to the 3-year ACS estimates, which have been discontinued in 2013. Table 4 shows estimates for 2005 to 2007 and 2014 to 2016; these represent the earliest and the most recent ACS data available. At the beginning of the period, four of the five boroughs of New York City – the Bronx, Brooklyn (Kings County), Manhattan (New York County), and Queens – were in top six; Cook County, Illinois, and Orange County, Florida were ranked third and fourth. By 2014–2016, while the Bronx remained in first place, Manhattan had dropped four spots to ninth, and Brooklyn fell from second to third rank. The Bronx, Brooklyn, and Manhattan recorded population decreases between 10% and 17% over the period, totaling a net loss of over 90,000 persons of Puerto Rican origin, while Queens recorded only a very slight increase. Chicago (Cook County, IL), which had the third largest Puerto Rican population in 2005–2007, also saw little growth over the period. In contrast, the largest numeric and percentage increases were in Florida: The Puerto Rican populations in Orange, Hillsborough, and Osceola counties grew between 50% and 78% over the period, and these three counties moved up between 2 and 4 spots in the ranking. Increases between 34% and 40% were recorded in the Connecticut River Valley (Hampden County, MA; Hartford County, CT; and New Haven County, CT), followed by Philadelphia (+28%). Growth was comparatively slower in South Florida, with Broward and Miami-Dade counties recording increases between 15% and 24%; both counties dropped in the ranking.
Table 4. The Top 15 Counties for Puerto Rican Residents in the United States
Migration Flows from Puerto Rico vs. from Other States
Inflows from Puerto Rico account for only part of the growth of the Puerto Rican population in Florida and other states. Puerto Ricans also move between states, and the population changes through natural increase[1] as well. Figure 4 compares the annual inflows from Puerto Rico to Florida to the migration flows of Puerto Ricans moving from other states to Florida during 2005-2016[2]. Interestingly, in all years but 2014 and 2015, there were more Puerto Ricans moving from other states to Florida than moving from the island itself. However, migration from Puerto Rico has increased over the period while the migration of Puerto Ricans from other states has been relatively flat. Furthermore, migration flows of Puerto Ricans from Florida to other states also exceeded flows from Florida to Puerto Rico over that period, making the net exchange more balanced (data not shown).
Figure 4. Annual Inflows of Puerto Ricans to Florida, Puerto Rico vs. Other States,
2005–2016
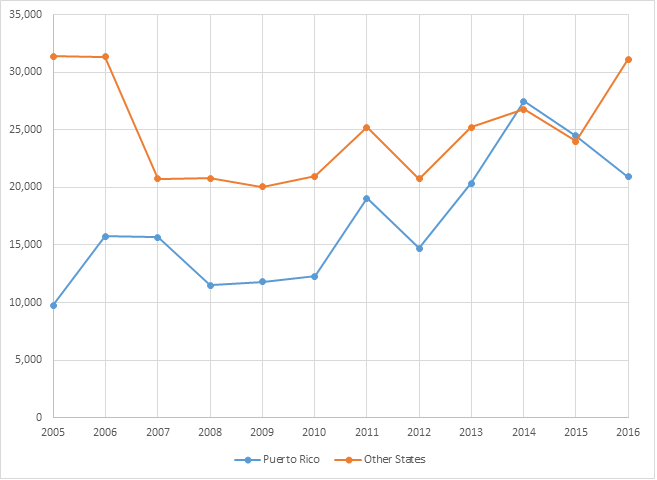
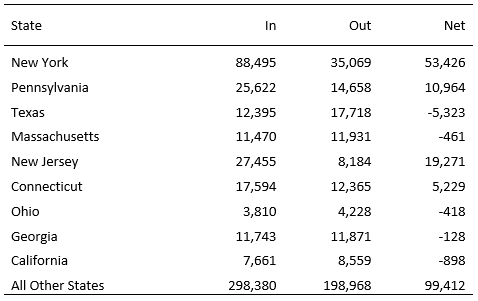
Table 5 displays Florida’s cumulative in-, out-, and net migration flows of Puerto Ricans with the nine states that recorded the largest inflows from Puerto Rico from 2005 to 2016; also shown are the total exchanges with all other states. Over the twelve year period, about 300,000 Puerto Ricans moved from other states to Florida, about 200,000 moved from Florida to other states, resulting in a net gain of about 100,000 Puerto Rican residents. The most lopsided exchanges were with New York and New Jersey; inflows of Puerto Ricans from these two states to Florida exceeded outflows by about 150% and 235%, respectively. Over the period, about 53,400 more Puerto Ricans moved from New York to Florida than moved in the other direction; other sizable net gains were recorded with New Jersey (+19,300) and Pennsylvania (+11,000). Florida had positive net migration flows with only four of these nine states, as more Puerto Ricans moved from Florida to Texas, Massachusetts, Ohio, Georgia, and California than vice versa. However, except for Texas (–5,300), Florida’s net migration losses to these states were quite small.
Table 5. In-, Out-, and Net Migration of Puerto Ricans between Florida and Other States,
2005–2016
The Impact of Hurricane Maria
The Puerto Rican population in Florida has grown substantially since 2000, especially in Central Florida. The devastation brought about by Hurricane Maria that struck Puerto Rico and the U.S. Virgin Islands in late September of 2017 has raised questions about the demographic impacts on Florida. Since early October, large numbers of residents have been reported leaving Puerto Rico and moving to the U.S. mainland, with Florida being a prime destination. Data on actual flows, however, are still quite sparse, and estimates of the overall size of the flow – both current and for the near future – vary widely. Flight arrival data provide some information, but have historically overstated actual migration flows by wide margins. This is because most air passengers are not migrants, but tourists, people traveling for business, those visiting family and friends, etc. It is likely that the proportion of migrants from Puerto Rico among air arrivals has been much higher after Hurricane Maria than was true in the past, but we don’t yet know by how much.
The most recent Demographic Estimating Conference held December 5, 2017, in Tallahassee, FL, estimated about 53,000 Puerto Ricans and U.S. Virgin Islanders moving to Florida permanently in response to the impacts of Hurricane Maria.[3] This estimate was based on counts of Puerto Ricans that have visited Multi-Agency Resource Centers at Orlando International Airport, Miami International Airport, and the Port of Miami through the end of November 2017; flight arrivals and school enrollment data were also considered when making this estimate. It is a reasonable estimate, given the available information at the time, but the eventual number could turn out quite differently. To us, this estimate seems somewhat conservative; we note, however, that some of the higher estimates that have circulated in the news appear to be highly speculative given the available data. This is a good reminder that estimates, like the ACS PUMS data used in this article, include margins of error. However, they are still valuable when done with care, for they do provide information. While we don’t yet know how many Puerto Ricans will ultimately decide to leave the island as a response to Hurricane Maria, a not inconsequential demographic impact on Florida seems likely, especially for the greater Orlando area.
[1] Natural increase is the balance between births and deaths. The Florida Department of Health online data query system FLHealthCHARTS provides birth data for various Hispanic origin groups including Puerto Ricans. The death data, however, are only provided for Hispanics without further origin detail. Consequently, calculating natural increase for the Puerto Rican population in Florida is not possible with the available data.
[2] The migration flows in Figure 4 and Table 5 are restricted to persons of Puerto Rican origin; in contrast, the migration data shown in Figures 1–3 and in Tables 2 and 3 include all migrants from Puerto Rico, including those who are not of Puerto Rican origin. Although the majority of migrants from Puerto Rico are of Puerto Rican origin, not all are. Consequently, the annual migration flows from Puerto Rico to Florida shown in Figure 2 are somewhat higher than those shown in Figure 4.