
Natural Decrease In Florida
- Stefan Rayer, Ph.D.
The difference between the number of births and the number of deaths is called “natural increase.” When the number of deaths exceeds the number of births, natural increase is negative; alternatively, one can use the term “natural decrease” in this instance. The population of an area can change through natural increase and migration. Most of the population growth in Florida’s history has been due to migration. Even at the height of baby boom in the late 1950s and early 1960s, more than two-thirds of statewide population growth was attributed to migration. Over the entire period since 1950, migration accounted for 83 percent of Florida’s population growth, while natural increase contributed the remaining 17 percent. While natural increase is still positive for the state overall, in 2014, for the first time, more Florida counties (37) experienced natural decrease than natural increase (30).
Figure 1 shows a map of the 37 counties that experienced natural decrease in 2014. Counties where deaths exceeded births were widely distributed across the state, covering most areas with the exception of the western Panhandle, parts of northeastern Florida and the I-4 Corridor, and most of South Florida. This is a big change from just a few years ago. Figure 2 shows that in 2007, only 14 counties experienced natural decrease, most of them located in Central Florida. These 14 counties – Charlotte, Citrus, Dixie, Glades, Gulf, Hernando, Highlands, Indian River, Marion, Martin, Pinellas, Sarasota, Sumter and Volusia – tend to have above average proportions of the population aged 65 and older. Many of these counties are retirement destinations, and most have experienced natural decrease for many years.

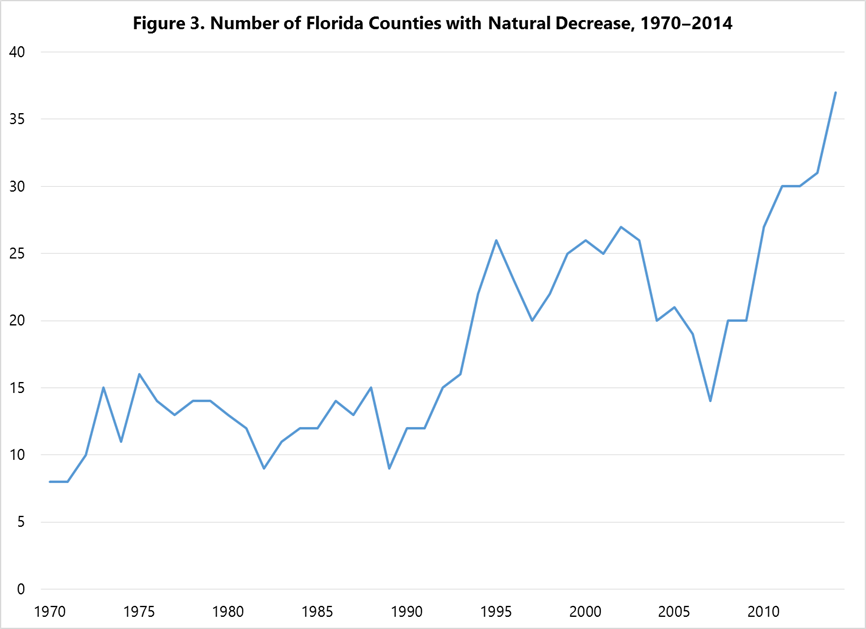
How common has natural decrease been at the county level in Florida, and how has it changed over time? Figure 3 displays the number of Florida counties experiencing natural decrease each year from 1970 to 2014. The general trend over this 45-year span has been upward, though there were periods when the number stayed relatively constant or declined. In the 1970s, 1980s and early 1990s, the number of counties with natural decrease was relatively low, fluctuating between 10 and 15 (out of the 67 Florida counties). That number then increased to between 20 and 25 in the late 1990s and early 2000s, before dropping again from 2003 to 2007. Since 2007, it has gone up steeply, exceeding 30 counties for the first time in 2013 and peaking at 37 counties in 2014. The vital statistics data for 2015 are still provisional but are very similar to 2014 with 38 counties experiencing natural decrease.
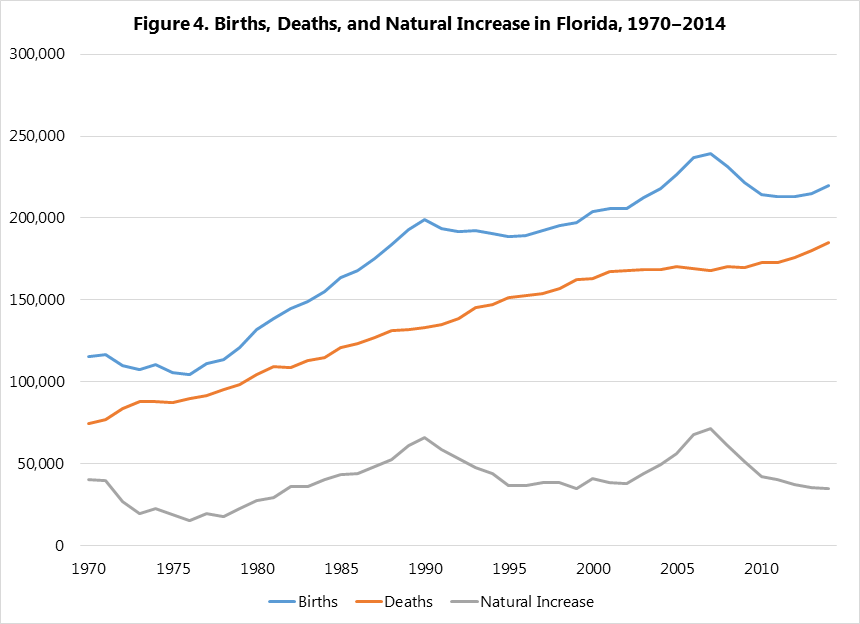
What accounts for these changes in the number of counties experiencing natural decrease? Figure 4 shows annual births, deaths, and natural increase in Florida since 1970. The chart indicates that the ups and downs in natural increase have mostly been due to fluctuations in the number of births. The number of deaths, in contrast, has followed a fairly consistent upward trend over time. When the number of births was peaking – such as in 1990 and 2007 – a smaller number of counties experienced natural decrease (see Figure 3). Conversely, when births decreased – such as in the early 1970s, the early 1990s, and after 2007 – the number of counties experiencing natural decrease went up.
The number of births is affected by many factors. It goes up or down when fertility rates change. Even when fertility rates stay the same, the number of births can increase or decrease with changes in the number of women of childbearing age. Births often respond to economic conditions, going down during recessions and increasing in periods of economic growth. The demographic characteristics of the population also play a role. In Florida and the nation overall, birth rates for non-Hispanic whites are, on average, lower than those for non-Hispanic blacks and Hispanics. Migration, in particular the demographic characteristics of migrants, has an impact as well. For example, areas where in-migration is dominated by young workers will likely have larger increases in the number of births than retirement destinations.
In addition to the ups and downs in births, the aging of the population also affects natural increase. The number of deaths in Florida is projected to rise substantially in the coming years because of the aging of the baby boomers. According to the latest BEBR state projections for Florida, natural increase will decline steadily, with the state switching to natural decrease sometime around 2030. BEBR doesn’t project births and deaths at the county level but, given the projected statewide changes, it seems likely that there will be more counties experiencing natural decrease in the coming years than right now. Changes in fertility and mortality rates could affect these trends, of course, as would shifting migration patterns.
We conclude with a look at trends in natural increase and decrease for individual counties. Table 1 shows natural increase/decrease for five-year periods since 1970 at the county level in Florida; periods of natural decrease are highlighted. Also shown are natural increase/decrease totals for the entire 45-year period, along with the number of years a county has experienced natural decrease. Four counties (Charlotte, Citrus, Pinellas and Sarasota) had natural decrease every year since 1970; another four (Hernando, Highlands, Pasco and Volusia) had natural decrease in all but a few years. At the other end of the spectrum, 24 counties have never experienced natural decrease. These 24 counties range widely in population size and are located throughout the state, including several small counties in the Panhandle and most of the largest counties with the exception of Broward and Palm Beach, which experienced a few years of natural decrease in the late 1970s and early 1980s but have had natural increase since then. The largest counties have accounted for most of the population growth due to natural increase since 1970; just five counties – Broward, Duval, Hillsborough, Miami-Dade and Orange – have accounted for almost 80 percent of statewide natural increase. Natural decrease has been greatest in Pinellas (–151,679), followed by Sarasota, Pasco, Volusia, Charlotte and Citrus counties.
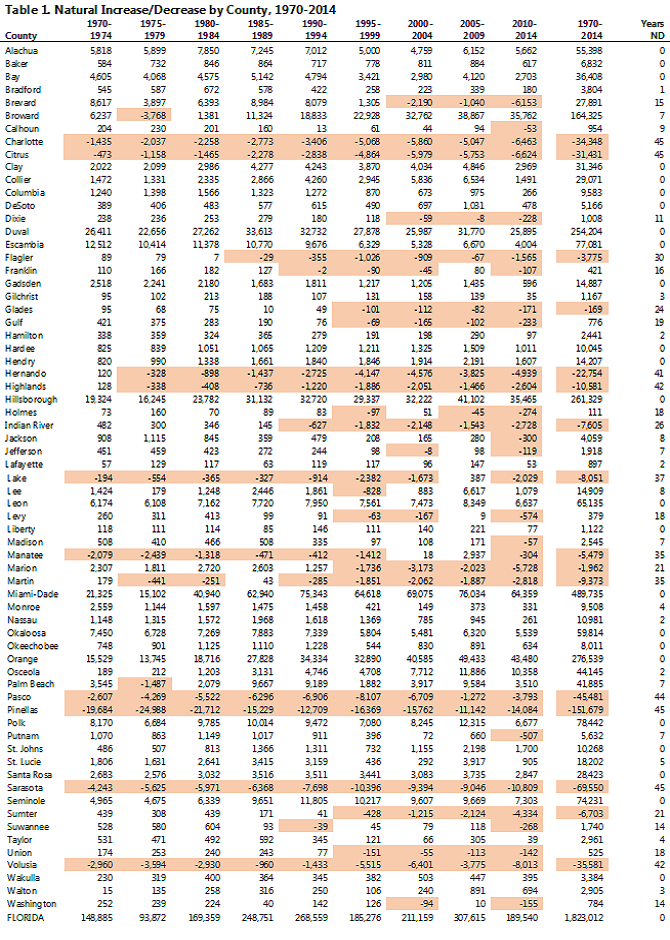
Table 1 also shows how natural decrease has become more prevalent over time. Many of the counties that are currently experiencing natural decrease had periods of natural increase in earlier years; in contrast, there are very few counties that had natural decrease in the past and are now experiencing natural increase. For some counties, the shift toward natural decrease has been quite pronounced. For example, both Marion and Sumter counties had natural increase in the 1970s, 1980s and early 1990s before switching to natural decrease 1994; since then, natural decrease has become progressively more negative in both counties. Several other counties such as Brevard, Gulf, Indian River and Union also fit this pattern, although the timing of the switch from natural increase to natural decrease varies.
When there are more deaths than births in an area, it creates a drag on population growth, since natural decrease – without being compensated by positive net migration – means population decline. In Florida, though, many counties that have experienced natural decrease have also grown in population, sometimes quite rapidly. The total population of Sumter County, for example, grew by about 75 percent from 2000 to 2010, even though the county experienced natural decrease throughout the decade. Several counties with long-term natural decrease are retirement destinations that attract large numbers of migrants; they have been growing as well. This is not true in other parts of the country, especially in the Northeast and Midwest, where areas with natural decrease are often associated with declining populations because population losses due to natural decrease are not compensated by positive net migration. But even in Florida, population growth over the coming decades will likely be lower because of the greater prevalence of natural decrease.
Sources and notes:
The birth and death data used in this article come from the Florida Department of Health. The county-level numbers may differ slightly from the officially published numbers because of adjustments such as allocations of births and deaths where the county of residence was unknown.