Comparing incentivization strategies for cross-disciplinary collaboration – Outcomes at Arizona State University and University of Florida

Comparing incentivization strategies for cross-disciplinary collaboration – Outcomes at Arizona State University and University of Florida

Comparing incentivization strategies for cross-disciplinary collaboration – Outcomes at Arizona State University and University of Florida

In November of 2021 at Arizona State University (ASU), network scientists presented the results of a study comparing researcher collaborations at University of Florida (UF) and ASU. The study used information on collaboration between scientists at the two universities over 20 years to compare the way collaborations changed at UF as compared to the way they changed at ASU. While both ASU and UF are growing in size and interdisciplinarity, comparisons between ASU and UF are difficult due to the differences in size and disciplinary focus. Click here to view the presentation.

Networks of Collaboration and Research Interests at The Center for Humanities and The Public Sphere at The University of Florida

Networks of Collaboration and Research Interests at The Center for Humanities and The Public Sphere at The University of Florida

As part of a research project at the UF Center for the Humanities and the Public Sphere (CHPS), data was collected about the research interests, collaboration efforts, and classes taught by UF’s Humanities faculty members.

CHPS and the Network Science Program team of the Bureau of Economic & Business Research (BEBR) generated and presented a network profile of shared research topics and co-publications during a meeting of the Social Network Analysis Journal Club at UF’s College of Liberal Arts and Sciences (CLAS).

The insights into the underlying social and topical structure are a profound representation of the research and teaching activities within the humanities field. The results would ideally enable Humanities faculty members to identify and approach groups and individuals for promising future collaborations on shared research topics.

Networks of Collaboration and Research Interests at The Center for Humanities and The Public Sphere at The University of Florida

Using Network Science to Identify and Bridge Scientific Communities at a Research University

Using Network Science to Identify and Bridge Scientific Communities at a Research University

Using Network Science to Identify and Bridge Scientific Communities at a Research University

At the 2018 Translational Science Conference, BEBR’s Network Science Program team gave a presentation on their data analysis techniques and intervention strategies. The goal of the Network Science Program team is to expand network science and the inner workings behind “team scienceat UF by mapping and analyzing collaboration networks across CTSA hubs and designing network interventions to stimulate collaborative research at UF and across the CTSA consortium. The program’s research is based on collective data from publications, grant proposals, and office space usage, as well as membership in PhD committees.

The Structure, Evolution and Interaction of Multiplex Networks of Scientific Collaboration at a Research University

The Structure, Evolution and Interaction of Multiplex Networks of Scientific Collaboration at a Research University

The Structure, Evolution and Interaction of Multiplex Networks of Scientific Collaboration at a Research University

Download The Report :
Multiplex.pdf

The aim of this paper is to contribute to the understanding of the structural evolution of scientific collaboration networks. A large body of literature has focused on the structure and evolution of co-authorship networks, typically examining networks within a specific discipline, but spanning different academic organizations. By contrast, this paper narrows its focus to a single academic organization (the University of Florida), but expands the network boundary in two ways: including collaborations among scientists in many different disciplines; and examining three dimensions or layers of scientific collaboration, namely, co-authorship on peer-reviewed scientific articles, co-participation in awarded grants, and co-membership in PhD/Master committees.


As a result of collecting data from a five-year window (2011-2015), we obtain a multiplex longitudinal network including three layers (publications, grants, committees). The geometric intricacies of this network are analyzed by looking at the evolution of its global and local properties, in order to shed light on its stochastic formation process, and on the role played by single investigators.

First, we study the network community structure of each layer, and the extent to which community membership is explained by factors such as disciplinary affiliation and workplace location. Results show that intra-department relations are as important as inter-department relations for community formation in the three layers, with department affiliations predicting approximately 50% of the community structure over time. However, we find a high rate of heterogeneity in network communities: publication communities predict respectively 45% and 30% of community memberships in the grant and committee layer. This finding suggests that each dimension of collaboration only partially influences the other, and different mechanisms may drive connectivity in different layers.

First, we study the network community structure of each layer, and the extent to which community membership is explained by factors such as disciplinary affiliation and workplace location. Results show that intra-department relations are as important as inter-department relations for community formation in the three layers, with department affiliations predicting approximately 50% of the community structure over time. However, we find a high rate of heterogeneity in network communities: publication communities predict respectively 45% and 30% of community memberships in the grant and committee layer. This finding suggests that each dimension of collaboration only partially influences the other, and different mechanisms may drive connectivity in different layers.

Second, we test the topological weaknesses of the layers to assess the role of single scholars in connecting different areas of the network. We find that co-authorship and committee network structures are somewhat similar: they appear to gradually converge toward a power-law degree distribution, with a network architecture sustained by interlinked “stars”, which for the co-authorship network is consistent with a small-world model. On the contrary, the grant network shows a core-periphery structure. By testing different breakdown scenarios, we conclude that only the committee layer presents a highly resilient architecture, while network connectivity in the other two layers is strongly dependent on the presence of few hub investigators. This finding has significant implications for academic research policy, suggesting that academic research networks would benefit from a system of incentives for highly-connected scholars to i) remain in the university maintaining an efficient network of collaborations; and ii) increase the involvement of their collaborators in research projects, in order to reduce the dependency of the overall network from their own work. A number of inferential tests and heuristic methodologies are implemented to assess the robustness of our findings.

Creative Solutions to Elusive Data: Web-Scraping Online Police Reports to Map Co-Offending Networks in US Cities

Creative Solutions to Elusive Data: Web-Scraping Online Police Reports to Map Co-Offending Networks in US Cities

Creative Solutions to Elusive Data: Web-Scraping Online Police Reports to Map Co-Offending Networks in US Cities

One truth new researchers quickly discover is that data collection is costly. In the social sciences, researchers expend copious amounts of time and grant money observing people, interviewing them, or gathering records about their characteristics and behaviors. Original Publication Date: Wednesday, May 30, 2018

The more bountiful the fruits of our labor the more we guard them from other researchers[1]. Data collection costs are particularly high in certain fields. Criminological data, for example, typically contain sensitive information on criminal behavior and victimization, which makes them more highly protected and at times inaccessible. However, with the recent developments in data science and computing this once elusive data have become much more accessible, provided you have the tools and the know-how[2]. This article shows an example of how free software tools can be used to scrape criminological data from the web to study crime and victimization patterns in US cities.

The tool, in this case, is the R project, a completely free, open-source software environment and programming language designed for statistical computing and graphics. The community of R users has been expanding exponentially in recent years[3]. This has led to the development of a vast array of freely available “add-on” packages to perform tasks which move far beyond the scope of other statistical software such as Stata, SAS, and SPSS. The sweeping versatility of R relative to its competitors allows for creative solutions to collecting traditionally elusive crime data.

One of the traditional approaches to examining crime is via the analysis of official records. Typically this would require that we approach Police Departments, Prisons, and other criminal justice agencies in the hope that we might be granted access to the necessary data. However, in the age of the Internet many criminal justice agencies publish information online. One well-known example is the Uniform Crime Reports (UCR), published annually by the Federal Bureau of Investigation (FBI). The UCR includes swathes of information on nationwide crime, law enforcement deaths and assaults, and hate crimes.

While a lot information can be gained from national data sources such as the UCR, many criminological researchers are interested in crime at a more local level. Unfortunately, this is the level where crime statistics become more sensitive and difficult to access. That said, many local police departments have been quietly publishing official records on individual arrests, incidents, citations, ordinance violations, and traffic accidents to the ‘daily bulletin’ boards found on their respective websites. The result is an extraordinary wealth of untapped local crime data available online, in some cases for as long as a decade. R and its packages can be used to “web scrape” these data sources.

Web scraping is an automated, systematic approach to extracting and refining online information. In the social sciences it is most often used to collect data from social media and networking websites such as Twitter, Facebook, LinkedIn and the like. Open source software such as MassMine and R packages such as twitteR have helped streamline data scraping, becoming popular tools for downloading tweets, statuses, and posts[4]. While these tools target social networking websites, web scraping targets the underlying text-based HTML code composing both these and other websites. R functions can recognize patterns in HTML code (such as HTML start and end tags), extract raw text from HTML pages, and convert that text into a dataset that is amenable to statistical analysis.

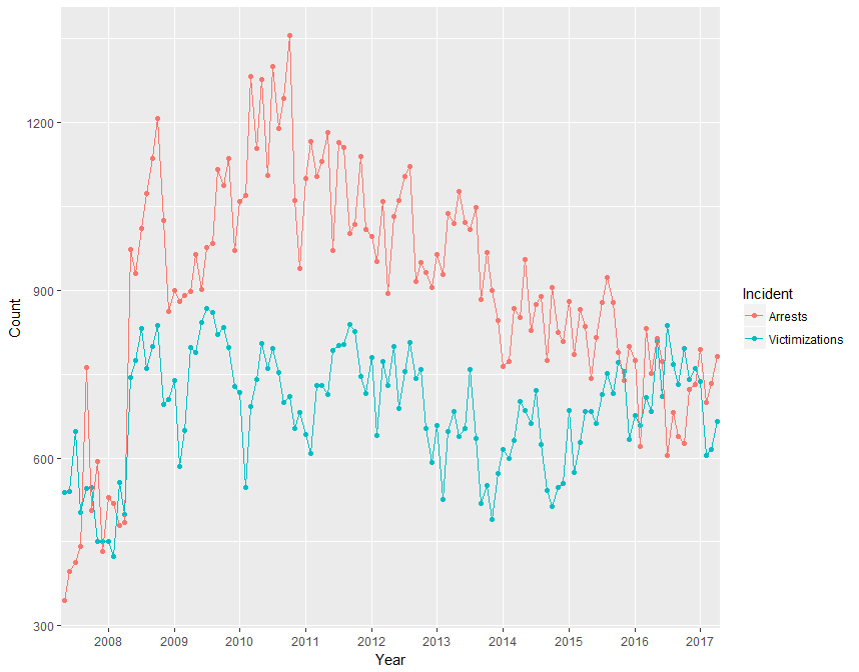
We used base R in conjunction with RSelenium, a package designed to automate website navigation, to scrape police incident data from the Gainesville Police Department website and six other US police departments (Union County PD, South Carolina; Wilmington PD, North Carolina; Cedar Hill PD, Texas; Cleveland County PD, North Carolina; Concord PD, North Carolina; Wood County PD, Ohio). The raw data includes roughly 1.6 million incidents from 2007 to 2017 with information on the individuals and locations involved in arrests, citations, summons, ordinance violations, victimizations, and traffic accidents. Each observation also identifies the responding police officer and the time of the incident down to the minute. We focus on victimizations, information on the offenses committed against citizens or institutions which violate the law and subsequently reported to the respective police departments by the victims, and arrests, information on the offenders who have been formally apprehended[5] by the police for committing one or more of these offenses. Table 1 and Figure 1 show some of the information that can be obtained from the Gainesville, FL arrest and victimization data.

Table 1. Characteristics of Arrests and Victimizations in Gainesville, FL between 2007 and 2017

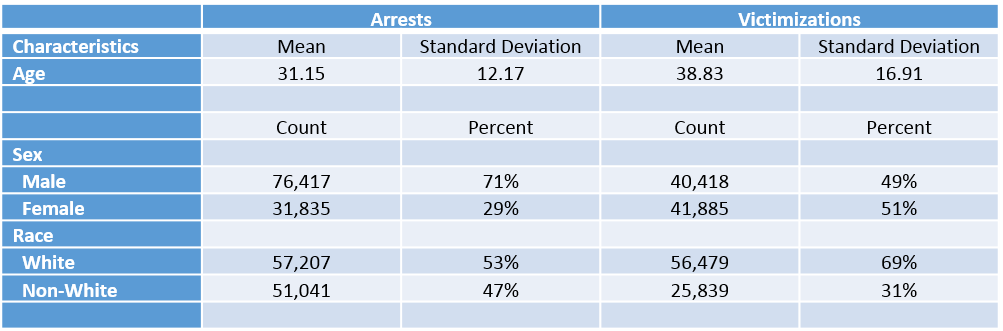
Figure 1. Monthly Arrests and Victimization in Gainesville, FL between May 2007 and April 2017

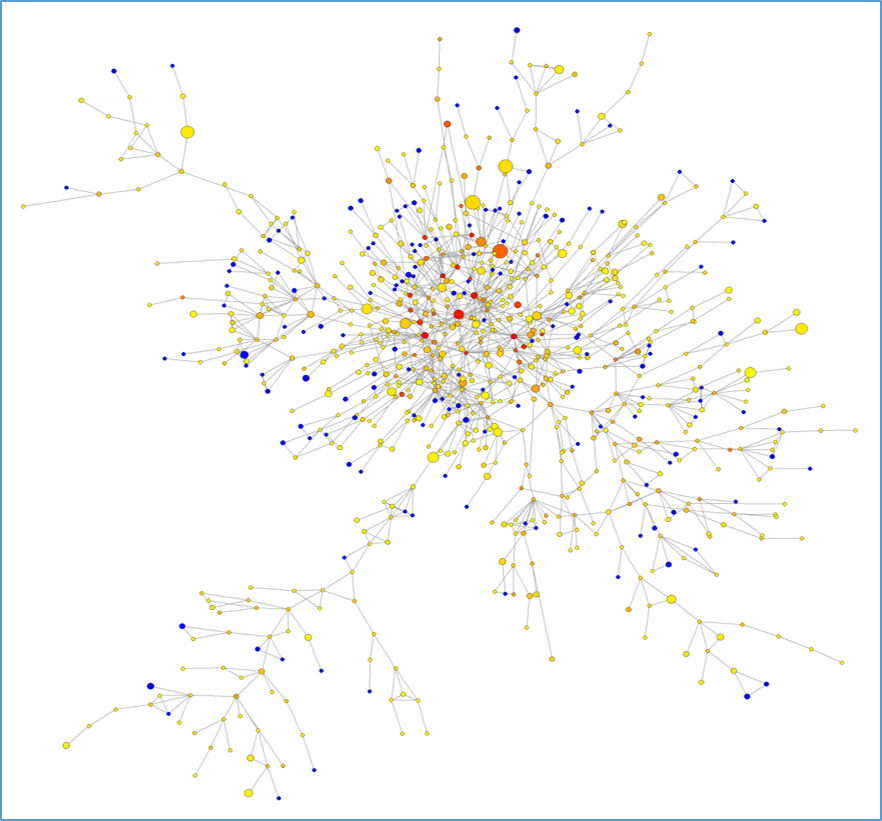
In addition to traditional statistical description and modeling of crime patterns, these data can be used to map ‘co-offending networks’ – networks of people who commit crimes together. It is well-known that crime is often committed by groups[6]: it is a form of human interaction, and it can be analyzed as a social network[7]. Two individuals are co-offenders if they are arrested during the same incident: in a social network this produces a link between them. As an example, we constructed a co-offending network using the decade of arrest data scraped from the Gainesville Police Department website. This network consists of 34,822 people (nodes) distributed in 28,887 disconnected components. The largest component (Figure 1) consists of 834 people[8]. This could be a group of interrelated gangs, or groups of University students co-offending with their peers. In this figure, the size of the node represents the number of experienced victimizations, the larger the node the more victimizations. Arrests are represented by the node color, the ‘hotter’ colored nodes representing a greater number of arrests. This allows us to examine the ‘victim-offender overlap’, the consistently replicated observation that victims of crime are often known offenders[9]. Co-offending networks can also be used to identify subgroups, such as gangs or crime families; detect the most central offenders, who participate in criminal activities with many other partners; and examine how crime “partnerships” and groups form.

The potential of web scraping is limited only by the information available online. Whenever there are data embedded in any given website’s HTML, it is possible to use web scraping techniques to access and refine these data. Consequently, web scraping need not be limited to a single source or type per project. For example, we plan to scrape hourly weather data from Weather Underground, and merge them with the arrest data. Research has long found that violent crime, including assault, domestic violence, and to a lesser extent homicide, become more frequent as temperature increases[10]. The arrest and weather data obtained via web scraping could allow us to examine the relationship between weather and crime more in-depth. The Internet also houses information which could let us examine cultural events (e.g. movie openings) and victimization by scraping data from websites such as boxofficemojo.com, or natural disasters and looting by incorporating data from the Federal Emergency Management Agency (FEMA). The knowledge from such projects could help local law enforcement better plan their activities based on weather forecasts, expected foot traffic from cultural events, predict looting targets following hurricanes, and beyond.

R-supported web-scraping techniques provide wide access to vast quantities of up-to-date information on an almost unlimited range of topics. As an affordable and easily reproducible mode of data collection, they have the potential to drastically transform the way we do research about crime and human interactions[11].

Figure 2. Gainesville, FL Co-offending Network from May 2007 to April 2017


[1] Kitchin, R. (2014). The Data Revolution: Big Data, Open Data, Data Infrastructures & Their Consequences. Washington, DC: SAGE

[2] And, of course, the approval of your Institutional Review Board.

[3] Tipperman, S. (2015). Programming tools: Adventures with R. Nature News, 517(7532), 109.

[4] Thomson, R. and Vacca, R. (2018) Collecting and Analyzing Big Data on a Small Budget. Bureau of Economic and Business Research.

[5] But not necessarily charged or sentenced.

[6] Warr, M. (2002) Companions in Crime: The Social Aspects of Criminal Conduct. New York, NY: Oxford University Press

[7] Papachristos, A. V. (2014) The Network Structure of Crime. Sociology Compass, 8(4): 347-357

[8] This is substantially more than the next largest component, which only consists of 28 nodes.

[9] Jennings, W. G., Piquero A. R., and Reingle J. M. (2012) On the overlap between victimization and offending: A reviewof the liteture. Aggression and Violent Behavior, 17: 16-26

[10] Cohn, E. G. (1990) Weather and Crime. British Journal of Criminology, 30: 51-64

[11] Munzert, S., Rubba, C., Meiβner, P., and Nyhuis, D. (2015) Automated Data Collection with R: A Practical Guide to Web Scraping and Text Mining. West Sussex, UK: Wiley

Author(s):Smith, Thomas Bryan; Vacca, Raffaele

Designing a Network Intervention on the UF Scientific Network

Designing a Network Intervention on the UF Scientific Network

A Social Network Analysis of Scientific Collaborations at the University of Florida

Social Network Analysis (SNA) is a methodology and a theoretical perspective that studies patterns of relations among actors. When applied to the network of scientific collaborations at a university, SNA can provide many insights on the structure and the evolution of its scientific community.

Part I: Defining and Constructing the Social Network of Scientific Collaborations at the University of Florida

A social network is a set of actors and the relations among them. Defining actors as researchers at UF, and relations as professional collaborations between researchers, we can use publicly availble data on publications and grants to visualize the social network of scientific collaborations at UF over the years. This reveals the structure of UF scientific community, and its interaction with formal organizations and institutional boundaries like departments, institutes and academic units.


Part II: Visualizing Group And Actor Characteristics In Collaboration Networks

Once we have network data on the UF scientific community, we can use SNA to visualize and analyze specific kinds of collaboration (e.g. publications vs grants); the position and centrality of particular departments, centers or institutes within UF’s scientific network; individual characteristics of UF researchers, be they network properties (e.g. actor centrality) or non-network attributes (e.g. researcher’s number of publications); the evolution of the UF scientific network over the years. SNA methods also allow us to detect cohesive subgroups(“communities”) of researchers who tend to work together in the university. Furthermore, the UF network can be aggregated from the individual level of researchers to the collective level of UF organizations, so as to visualize networks of collaborations among UF departments, institutes or academic units.